Tort Law – Any business field is affected by many aspects that may give rise to wrongful acts which may be done by the business or by a different party to a business entity. Tort law thus comes in to deal with any sort of the civil wrongs which may arise in line of doing business, such as negligence which emanates from other sources than breach of contracts (David Ziemer, n.d.).
One of the significant court cases in this category is the Palsgraf v. Long Island Railroad Co., 248 N.Y. 339, 162 N.E. 99 (1928). This case is considered to be among the leading in the American tort law in regard to liability to an unanticipated plaintiff (David Ziemer, n.d.). When a civil wrong occurs, both the individual and business could be financially and legally responsible for the injuries caused as a result of negligence. One of the main factor relied upon when determining negligence include the breach of duty by the defendant which they owe to the plaintiff.
The case of Palsgraf v. Long Island Railroad Co., 248 N.Y. 339, 162 N.E. 99 was handled by the New York Court of Appeals. In the case, Helen Palsgraf was the plaintiff and was waiting at the Long Island Rail Road station. She was on her way to take her kids to the beach. While boarding, two men tried to get on board before the plaintiff, and one dropped a package while being assisted by railroad employees, and it exploded. The explosion caused a huge coin-operated scale located at the platform to hit Palsgraf. She started stammering after the occasion and ultimately sued the railroad (Palsgraf, Punitive Damages, and Preemption, 2012). She argued that the railroad employees acted with negligence when they were aiding the man, and it was neglect that led to her harm.
Tort Law Dissertations
The plaintiff first got a jury verdict in which she was to be compensated $6,000, but the decision was appealed by the railroad. On Appellate Division, Palsgraf got 3–2 decision and the railroad appealed once more. In the New York Court of Appeals, the railroad won the case as the court overturned the original jury verdict. It was ruled that there existed no negligence as the employees did not have the duty of care to Palsgraf while they were assisting the man to board because the injury was unforeseeable harm from helping an individual with a package.
A dissent was however made stating that the employee negligently extricated the package thus dislodging it without clear knowledge of the contents in it, thus leading to the explosion which broke the scale and harmed plaintiff who was an intending passenger (Teacher, Law, 2013). The dissention held that regardless of the duty to plaintiff, the doer of negligent act should be held to account for the threat caused to other people’s safety and all its immediate consequences.
The ruling may outwardly appear to be unfair because
if the employees had been more careful with the package, the harm could not
have occurred. However, I agree with the ruling in that it is based on the law
of tort, specifically under the liability clause. The law holds that a tort
liability only occurs in the event that the defendant breaches a duty of care,
which such defendant is owing to the plaintiff, and in turn this act of
negligence leads to injury being sued for. This is the concept which was
accepted in the American tort law after the ruling made by the New York Court
of Appeals (Teacher, Law, 2013). This case shows how the law deals with the proximate
cause of the injury in connection to negligence.
References
David Ziemer. (n.d.). Duty of care remains thorny
issue in Wisconsin law. Wisconsin Law Journal (Milwaukee, WI)
Palsgraf, Punitive Damages, and Preemption.
(2012). Harvard Law Review, 125(7), 1757–2012
Teacher, Law. (November 2013). Palsgraf v Long
Island Railroad – Case Brief
Did you find any useful knowledge relating to tort
law in this post? What are the key facts that grabbed your attention? Let us
know in the comments. Thank you.
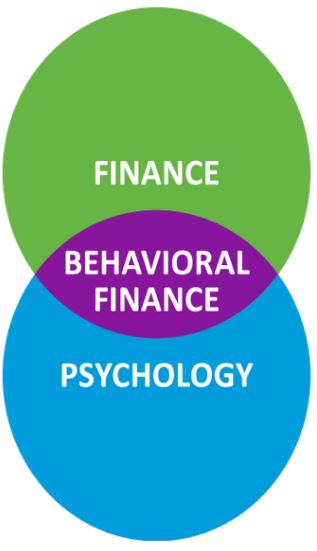
Behavioral Finance and
the Psychology of Financial Decision
Behavioral finance and financial decisions have a big role in shaping critical decisions that people make. The study summarizes the facts about financial choices and the behavioral and psychological theories influencing them. We learn that people have predisposed cognitive constraints coupled with low levels of financial literacy, in such regard, their decision-making choices violate sound financial principles. The case studies teach us that most investors and managers over-extrapolate from past returns and trade, or they make decisions based on overconfidence and personal history.
We explain most of these behaviors based on behavioral finance theories like prospect theory, behavioral finance, and behavioral corporate finance. Many companies and institutions today shy away from traditionally defined benefit pension plans in favor of defined contribution plans, in such circumstance, the role of the financial adviser is gaining an integral value.
In this case study, a recent graduate from UMUC is employed to advise different clients on investment. The consultant delves into studying the biases in financial behavior that predict prospective theory. While applying the key concepts of behavioral finance, the consultant can recognize that the client (Violet) displays behavioral biases that impede optimal savings and consumption allocation. He can learn this by deducing from concepts of finance that assess how people organize their financial assets by creating separate slots for money designated for specific roles as well as other approaches such as mental accounting.
Expected Utility and Prospect Theory:
Unlike most of the economic
theories, Expected utility theory is the most preferred by scholars ((Shiller, Robert J.). The approach attracts people
because it has the best economical representation characterizing true rational
behavior in uncertain situations. However, application of expected theory is
criticized in many circumstances because of the systematical misrepresentation
of human behavior.
Allais (503)
proved that Prospect Theory refers to a mathematically developed theory
that substitutes “value function” contrasted to “utility function” and
“weights” contrasted to “probabilities” in expected utility theory. Here,
people work to increase the weighted total value instead of utility such that
probabilities do not equal weight. Simply put, people view extremely probable as
certain but the improbable events as impossible.
In many circumstances, prospect
theory appears inconsistent with expected utility theory. To begin with, in
probabilities, utility is all linear but not value. Also, value is defined
regarding losses and profits, but utility depends on final wealth.
Contrary to expected utility
theory, prospect theory foretells that preferences depend on how a problem is
approached. In case the reference point defines the outcome as an advantage, in
this case, the resulting value function will be curved in, and those making
decision will be risk-averse. But if the
reference point’s outcome is seen as a loss, those making decisions will be
risk seeking since is a convex value function.
Violations of Expected Utility
The possible abuses of this theory
include the Allais paradox (certainty effect), and inflation of small
probabilities. As for Allais paradox, there is an extreme underweighting of
high probabilities. In such a case, it falls short of certainties such that the
travel time outcomes become extremely attractive. On the other hand, inflation
of small probabilities violation projects itself in the form of a set of
stated-preference route-choice challenges.
Value Function
The definition of the value function lies on variations from a reference point,
and in most circumstances, it is risk aversion–concave for gains, convex for
losses. Similarly, value function is acute for losses than for profits. In this
case, the stress of decisions is less compared with the equivalent
probabilities, with few exceptions in the assortment of low probabilities. A value strategy deals with the
purchase of stocks that have low prices compared with the dividends, earnings,
book assets, or similar measures of significant value.
The Implications of Prospect Theory for the Efficient Market Hypothesis
An efficient market, based on the definition
by (Fama 1965), is characterized by a large pool of rational profit maximizers
who compete against each other to interpret the market prices of individual
securities in the years to come; out of which a large pool of the present
information is easily available to all participants. The prevailing competition
in such a market opens the effects of new information on the actual prices in
an instantaneous way. In such a way, the prospect theory sets in under the
circumstance that makes stock price unpredictable following a random pathway.
Provided that information flow is
unrestricted and quickly reflects in the stock price, the probability for the
future price to change will depend not on today’s price changes, but on
tomorrow’s news. Given that news is unpredictable, consequently, price changes
also turnout unpredictable, and this conforms to the principle of prospect
theory whereby people view extremely probable as certain but the improbable
events as impossible.
Efficient
Market Hypothesis is characterized by the security prices that reflect
available information. It is based on the traditional view that investors use
rationale in executing the present information to increase the expected
utility.
Anomalies
The
Anomalies of Efficient Market Hypothesis’ set in when people feel there is
something wrong with the concept of Efficient Market Hypothesis. Under such
conditions, the rational approaches of investors lacks consistence. It is not wholly
right and must be analyzed alongside other human behavior approaches like the
prospect theory, overconfidence, or expected utility, or over and under
reaction, as well as the limits to arbitrage. Examples of anomalies as
expressed by prospect theory include the size, valuation, and the momentum
effect.
The Valuation Effect. Studies reveal that firms with higher P/B multiples are outperformed by those with low price/book (P/B) multiples.
The Size Effect. Studies predict that firms with smaller market capitalizations outperform those with large market capitalizations, disregard of the controls in their higher risk.
The Momentum Effect. Studies reveal that firms with good performance for the past six months to one year period outperform those that performed poorly over the same period.
Bias identification and how such behavioral finance concepts affect their investment decisions
The First Colleague: The Concept of Illusion of Control
The stated bias happens when people overly
justify their ideas. It describes people’s propensity to believe that they can
exert influence on the outcomes of action when, in the real sense, they cannot.
When this kind of bias occurs, people behave as if they can fully control their
situations than they actually can ((Ising, Alexander).
The first colleague responds by claiming to
know the technology industry and is determined to invest in them. While he
might have worked in the industry for a while, it is not justifiable to assume
that the circumstances will prevail in the long run. He is preoccupied with the
illusion of control bias.
However, the illusion of control bias can be
financially damaging since entrepreneurs might be motivated to trade more than
what is right. It may lead them to employ limit orders, maintain
under-diversified portfolios, or other related means just to express a false
sense of influence over their trade portfolios.
People who practice this bias find it hard
acceding with the irrationality and the changing nature of markets and the fact
that their expectation is a failed one. The outcome is a spiral of investment
catastrophe with the rationalization that while their belief is right, the one
who drove the buttons was so incompetent.
In the long run, the investor becomes
overconfident. The consequences of long-term investment may not be affected by
the immediate-term opinion, emotions, and impulses that frequently engulf
financial transactions. Rather, the success or lack of it emanates from
uncontrollable factors such as the prevailing economic conditions and corporate
performance.
The Second Colleague: Confirmation Bias
According
to the second colleague, the value of commercial property in the city has
maintained a 14% increase since the year 2000 reported a famous newspaper
article. Now, this is almost two decades down the line. It is very unbelievable
to assert that the value of the property has remained consistent over such a
lengthy period, and very few investors would settle on that. However, depending
on the interest of the reader and the prevailing circumstance, we can only
assume that the type of newspaper is biased towards such reports and that the
investor too is biased and love reading similar reports.
According
to confirmation bias, individuals are drawn to
information that substantiates their existing perceptions. It is just similar
when a person prefers watching news from a TV channel that represents his/her
political views while evading those that feature commentators of divergent
opinions. Similarly, people behave in the like manner concerning their
financial issues. Entrepreneurs believe in the market conditions will make them
walk toward information sources that validate such a belief.
While it is acceptable to attach an emphasis
to the consequences of our aspirations, for example, investing heavily in the
stock of the firm you’re working for, it poses significant risks when it comes
to diversification. If you should overcome confirmation bias, stress must be
levied on obtaining information from various.
The Third Colleague: Depicting Recency Bias
Recency
bias is a cognitive intrusion that encourages to perceive the most recent
information as more relevant compared to the old knowledge. However, this may
not be necessarily true. People base their investment decisions on how the market
has been recently performing. The exact state is seen on the third respondent
whose investment decisions in the Omega Corporation are drawn from the current
state of the company and industry. She denotes that from the decline of the
industry to capitalize on her investments since she presumes that case to
remain constant for some time.
Most entrepreneurs have the inclination to follow investment performance by investing more in the industry when it is peaking and just about to reverse. Given that the investment has been picking up recently, investors anticipate that to remain the case. However, based on the behavioral theory, it would be wrong for her to rely on this approach to make financial decisions. In most circumstances, people do extrapolate from recent performance and employ them as a signal of future performance which is very wrong. Consequently, entrepreneurs fall into the ploy of over-purchasing the now outperforming asset and under-own the now drifting asset.
Behavioral Finance Dissertation
Behavioral Finance and Investments
Siosan’s utility function. Contrasted with that assumed in traditional finance theory
Traditional finance posits that
humans are risk-averse, they love greater certainty than limited certainty and
have a perfect utility function. Conversely, behavioral theorists assume that
people display multiple characteristics and while they may be risk-averse, they
may also be risk-seeking, risk-neutral, or any blend of the three. Depending on
how things present themselves influences decision making.
The utility function measures an
individual’s preferences over a set of products, measured in units referred to
as utils. Utils exemplify the level of satisfaction of a consumer from choosing
a specific type or number of products. Traditional finance is built on the
utility theory with an assumption of diminishing marginal return. On the other
hand, Behavioral theorists assume that human beings don’t always
act in their best financial interests.
Appropriate in this
case study, the utility function specifies the satisfaction of an investor out
of all possible combinations.
For example, an investment with low risk and high return has a bigger utility
than that with high risk and low gain. This kind of function represents both
their welfare along with their preferences. Violet expresses utility function
that follows the behavioral approach. She wants to spend more. However, she’s
quite unaware of the circumstances of tomorrow reflected in her limited
investments. Under a traditional approach, Violet would either invest or not
invest at all. It would be that she has knowledge of the future market or she
does not, and if she lacks, her utility function would be concave. She would
spend less just to avoid the risks in the future.
Similarly, she purchases expensive
goods like cars and takes vacations for her satisfaction although, she feels
reluctant to incur debts. This is opposed to traditional finance that assumes a
diminishing marginal utility; Violet proposes utility function that will always
satisfy her interests and won’t diminish. Violet expresses some mix of
traditional and behavioral approach in some part, and traditional finance is
reflected in the way she detests debts. Albeit, she does little to avert those
debts, thus in part demonstrating a behavioral approach.
Siosian’s Behavioral Biases and how a rational economic individual in traditional finance would behave differently concerning each bias
Various cognitive predispositions cause
several behavioral biases or under-saving inclinations. This is according to
the perception by behavioral scientists who present several biases that emanate
from such predispositions by grouping them into three categories. Such include
preference biases, perceptions of prospects, perceptions on how to make
decisions bearing in mind the rest of variables, and price perceptions. The
typical behavioral bias presented in this case is the preference bias, and it
manifests itself in the form of the self-control, loss aversion, and
anticipatory utility.
Costly self-control bias- Living for today
Behaviorists
propose
that many people struggle with self-control in various fields. It may present
itself through over-eating, under-saving, or over-snoozing, what we can call as
“living for today”. Approaches to costly self-control
also suggest that such people will value commitment such that they will choose,
and even pay, to limit their future decision in some way, in an attempt to
discourage their future over-consumption predilections.
However,
in this case, study, Violet fits this model of costly self-control bias. We
find that she engages in costly endeavors like buying expensive cars and paying
for expensive meals in upscale vacation resorts. She does this at the expense
of investing. In fact, she would do all the best she can to live a luxurious
life while doing little on her mortgage and other investments. Her approach is
behavioral and contrary to how traditional theorists would behave since they
would fear the risks of tomorrow and would spend less on consumption and be
concerned about the future.
Loss Aversion
The bias is comparative to some reference
point like current consumption, or friends’ consumption. Loss aversion may also
be seen as a potential threat to consumers leveraging their savings rates.
People fear more to invest in their view of avoiding losses (Thaler, Richard, and Shlomo 164-187).
Loss aversion occurs when people easily
notice the reduction in investment portfolio more than how they view gains, and
this may be even when the profits are greater. They frequently get upset when
they lose money during the market recession such that they remember those
losses forever, but they would hardly remember the time they made 40-percent
increase, just the time they lost 30-percent. We can state that Violet has an
outspoken loss aversion bias when she says she detests making losses. Given
that she has very little investment but high expenditure, this might be the
reason why she rarely invests. Her approach reflects a traditional finance
theory that assumes people are risk-averse.
Siosian’s Retirement Portfolio and Justification
Violet’s retirement portfolio is such that
she maintains a minimal retirement plan where she deposits half the sum of
money coming from her annual bonuses and none-salary incomes. On the other, we
notice that she runs a very small mortgage and limited investments that can
sustain her. Basing on such decisions, her retirement portfolio is so
inefficient.
The Social Security Administration posits
that on average, a 65-year pensioner can expect to stay for the next 18–20½
years after quitting the job (Benz par 3).
Nonetheless, health advancements now make people stay for more years, and it
would be advisable that you schedule a retirement portfolio of 30 or more
years, and in such a case, the retirement saving plan becomes so essential.
Rather than just depositing money in the portfolio, it should be used in
investment opportunities to generate more wealth for old age. The objective is remaining invested—and
that implies having some part of the money assigned to stocks, but in the right
standing with other investments.
The objective of investing retirement
portfolio is to generate a mix of investments that merge to preserve capital,
create income, and expand. Such a combination of stock, bond and cash investments
must be in line with age, income, financial needs, time, and risk. For this
reason, we can say Violet’s retirement portfolio is very weak and inappropriate (Williams par 6).
Behavioral Corporate Finance
MEMO
TO: CFO
FROM:
DATE: 28/04/2019
RE: Recent Behavioral Finance Literature dealing with the Board of Directors.
We can study behavioral finance
featuring the panel of executives under the concept of corporate governance ((Shivdasani, Anil, and
Marc Zenner). Management of financial institutions has taken a different
approach given the attrition of the significance of corporate governance in
guiding financial decisions. Albeit, this is very recent studied by
contemporary economists who assert the role of the board of governors in
guiding the company’s value creation and improved financial performance
particularly during this onset of consistent corporate flaws. Many companies
have since collapsed, examples of Lehman Brothers, Rank Xerox, and Enron just
to name a few, all blamed the faulty board of governors (Shivdasani, Anil, and David Yermack).
We have several lessons to learn
from this shrinking–specifically–there is one lesson that stands out clear–the
role of corporate governance in determining its capacity to contest positively
particularly in stormy environmental conditions where others strive hard to
exits.
Contemporary literature on
behavioral finance vis-à-vis corporate governance emanates from Adolph, Berle and Means (23) study where they assert
that, in reality, managers of companies sought their interest at the expense of
the shareholders’ interests. Their
investigation stressed the need for an effective plan to help aid in mitigating
the conflict of interests between company owners and managers. Therefore, while
the concept of corporate governance might appear new, it addresses typical
concerns present since time long (Ayuso, Silvia, and Argandoña 2-19).
Many countries, corporations, and
agencies across the globe have started to respond to the corporate flaws by
initiating a series of legislation and guidelines that guide decisions of the
board of governors in financial implications. Such rules are referred to as the
codes of best practices. These legislations guide the behavior and structure of
the board of directors while doing their monitory and supervisory duties (Shivdasani, Anil, and David Yermack).
Such codes, though, issued in
different regions, they have similar peculiarities regarding corporate culture
and general corporate environment, and alignment of the interest of parties
(Shareholders and Management). Corporate governance codification of governance
aims at mitigating the corresponding deficiencies in or lack of appropriate
shareholders shields (Shivdasani, Anil, and David
Yermack).
Your Future and Behavioral Finance Post 2008
Behavioral Finance Lessons during
and after the Great Recession
Several themes emerge drawing from
the issues aired by Stephanie pertaining behavioral finance during and after
the great recession. While the economic downturn attracted several consequences
on the corporate world, I believe the corporate directors and other
stakeholders had the mandate to prevent its occurrence, and correspondingly,
they can stop the reoccurrence of the same by studying behavioral finance
theories. The recession affected the entire globe since businesses collapsed,
and many people lost jobs and houses. However, I believe that if financial
behaviorist can avoid a repeat of the 2008 great recession, they should derive
from behavioral finance theories, Shefrin and Staman reports this in their
book, ‘Behavioral Finance in the Financial
Crisis’.
Several factors drew the crisis, and such factors persist that
perpetuate the current crisis. They include; a weak government regulation,
investment banks that exceedingly leverage debts, and strained homeowners’
finances. We can explain the consequences of 2008 crisis from a financial
theory basis. While traditional economics base their assumptions of
rationality, they assert that people make rational economic choices as they try
to maximize their earnings. On the contrary, behavioral economists assume that
people make their financial selections based on their emotions psychological
conditions, as well as on cognitive errors.
The 2008 crisis is
best explained by the principles of behavioral economics. Here, we find a
correlation of the crisis with the overly optimistic lending behaviors of
people since such is connected to the stock market fluctuations even as
witnessed currently. Psychologists have effectively documented the propensity of
people to perceive the through
rose-tinted lenses, often referred to as the optimism bias.
Much of the 2008
crisis revolved around financial psychology. We can study psychology as part of
the behavioral finance theory. In essence, it incorporates aspects like
overconfidence, perception and cognition, aspirations, emotions, and culture (Morgenson, Gretchen and Joshua Rosner).
Overconfidence– Behavioral
economists had warned of the inhibiting economic crisis. While banks,
businesses, and many corporations received such warnings, many were
overconfident in their investments. Overconfidence Before the great 2008
recession, economists warned that the economy was going under. Entrepreneurs
were such overconfident such that they hardly analyzed the risk of holding such
huge portfolios in mortgage-backed securities, provided the threat of being in
a bubble. Most of the homeowners took out loans just to satisfy the American
dream — they purchased during a bubble overconfident that housing prices would
skyrocket and remain persistent.
However, an increase in the housing
market, and the stock market, only works to raise people’s overconfidence since
they would ascribe the gains or losses they achieve as a result of their
proficiency in finance, although, it results from market moods.
Recency bias was one
implication that cultivated the crisis. That’s because entrepreneurs make
choices based on the most recent information. Decisions may be constructed on
the very latest feedback. Although, such information may not be primarily
relevant. During the time, investors overreacted because of the congress’s
finance rescue project.
Similarly, people’s
emotions such as anger, fear, and sadness influence the type of decisions made,
including economic choices. More fearful people become risk-averse, but more
angry people become more enthusiastic to incur risks, even financial risks. As
for the economic downturn, people had others in mind to accuse of the financial
crisis. Take the example of Wall Street banks that became so angry such that
they easily took the financial risk to punish the offenders.
Behavioral
economists assume that the kind of financial errors made aren’t haphazard, and
the choice made too aren’t fundamentally rational. Rather, they are built on
psychological conditions such as cognitive errors and biases.
In our attempts to
evade the similar crisis in our market, we can learn a lot from the economic
downturn of 20008 and the related occurrences of the past. For instance, the
1974-75 economic recession almost resembled the 2007-2009 crisis. On the same
note, the twin Reagan-era recessions of the 1980s had profound consequences
such as joblessness and a subsequent S&L and sovereign debt crunch. The
1990s foreign currency crisis mandated an immediate discarding of the Long-Term
Capital Management without interfering with the worldwide economic system. Just
like Lipsky reports, the 2008 housing bubble was a consequence of a simmering
stock market.
Hindsight bias wrongly predisposes us to imagine we can see and analyze the future crises pretty well the way we do the previous and establish strategies that would impede future crises. However, we are limited to devise policies that can avert future crises should we even be able to identify them since those who would lose are in our paths standing against us. No doubt restraining bank leverage would do some good; nonetheless, bankers have the smack to strangle it. Consequently, we have a few decision left–our psychological fallibility. Assessing our psychological biases will work a great deal in averting and mitigating some crises.
Conclusion
From the discussion above, behavioral finance case studies focus on determining the clear-cut direction to which various market forces—such as rational analysis of organization-specific and macroeconomic basics; cultural, human and social psychology trends—affect investors and managers expectations and define their level of confidence.
Works Cited
Adolph, Berle, and Gardiner Means. The
Modern Corporation and Private Property. New York, NY, Macmillan, 1932.
Allais, M. “Le Comportement De L’homme Rationnel Devant Le Risque: Critique Des Postulats Et Axiomes De L’ecole Americaine.” Econometrica, vol 21, no. 4, 1953, p. 503. JSTOR.
Ayuso, Silvia, and Antonio Argandoña. “Responsible Corporate Governance: Towards A Stakeholder Board of Directors?” SSRN Electronic Journal, 2009, p.2-19. Elsevier BV.
Benz, C. “The Bucket Investor’s Guide to Setting Asset Allocation for Retirement.” News.Morningstar.Com, 2016, par 3.
Ising, Alexander. “Pompian, M. (2006): Behavioral Finance And Wealth Management – How To Build Optimal Portfolios That Account For Investor Biases.” Financial Markets and Portfolio Management, vol 21, no. 4, 2007, pp. 491-492. Springer Nature.
Lipsky, J. Overcoming the Great
Recession An Address to the Japan National Press Club, Remarks by John Lipsky,
First Deputy Managing Director of the International Monetary Fund, at the Japan
National Press Club, Tokyo, May 18, 2009. Tokyo: Japan National Press Club,
2009.
Morgenson, Gretchen, and Joshua Rosner. Reckless
Endangerment: How Outsized Ambition, Greed, And Corruption Led To Economic
Armageddon. New York, New York, St. Martin’s Griffin, 2012.
Shefrin Hersh, &Meir Statman. Behavioral
Finance in the Financial Crisis: Market Efficiency, Minsky, and Keynes.
Santa Clara: Santa Clara University, 2011.
Shiller, Robert J. “Bubbles, Human Judgment, and Expert Opinion.” Financial Analysts Journal, vol 58, no. 3, 2002, pp. 18-26. CFA Institute.
Shivdasani, Anil, and David Yermack. “CEO Involvement in the Selection Of New Board Members: An Empirical Analysis.” The Journal of Finance, vol 54, no. 5, 1999, pp. 1829-1853. Wiley-Blackwell.
Shivdasani, Anil, and Marc Zenner. “Best Practices In Corporate Governance: What Two Decades Of Research Reveals.” Journal of Applied Corporate Finance, vol 16, no. 2-3, 2004, pp. 29-41. Wiley-Blackwell.
Thaler, Richard H., and Shlomo Benartzi. “Save More Tomorrow™: Using Behavioral Economics To Increase Employee Saving.” Journal of Political Economy, vol 112, no. S1, 2004, pp. S164-S187. University Of Chicago Press.
Williams, Rob. “Plan, Allocate and Distribute: Structuring Your Retirement Portfolio for Your Income Needs.” Par 6. Schwab Brokerage, 2017.
If you enjoyed reading this post on behavioral finance, I would be very grateful if you could help spread this knowledge by emailing this post to a friend, or sharing it on Twitter or Facebook. Thank you.
Econometrics of France – General overview of the economy, identifying the main aggregate demand components that drive GDP growth
Econometrics – France is acknowledged due to its efforts in fighting poverty and improving employment among the citizens (Ciccone & Jarociński, 2010). The country is comprised of many sectors which work collaboratively to provide services and products to her citizens (Facchini & Melki, 2013). The country has been a member of IBRD since 1945 and was among the first country to receive their loan. The country has a population of over 66.8 million people as per the 2015 report. In overall, the country’s GDP was $2.4 trillion in 2015, which the country reported that it was growing at an annual rate of 1.2%.
Analyzing key econometrics such as GDP may not generally be the most pertinent synopsis of accumulated monetary execution for all economies, particularly when generation happens to the detriment of devouring capital stock (Ciccone & Jarociński, 2010). While GDP gauges in light of the generation approach are for the most part more dependable than assessments incorporated from the pay or consumption side, distinctive nations utilize diverse definitions, techniques, and reporting guidelines (UKDS, 2016). World Bank staff survey the nature of national records information and now and then make acclimation to enhance consistency with worldwide rules. All things considered, noteworthy disparities stay between universal guidelines and real practice (Sly & Weber, 2016).
Numerous measurable workplaces, particularly those in creating nations, confront extreme confinements in the assets, time, preparing, and spending plans required to deliver solid and far reaching arrangement of national records insights. Among the challenges confronted by compilers of national records is the degree of unreported financial action in the casual or optional economy. In creating nations a huge share of farming yield is either not traded (on the grounds that it is expended inside the family unit) or not traded for cash (Sly & Weber, 2016).
Private usage has usually been the driver of money related improvement in France and it coordinated the impact of the fiscal crisis in 2009. Regardless, in 2012, private use contracted unprecedented for over two decades in the aftermath of the crisis, amidst purchaser assurance levels that had debilitated and direct money related improvement rates (Facchini & Melki, 2013; Ciccone & Jarociński, 2010). After government use, which has remained by and large stable in the earlier decade, wander is the greatest portion of France’s budgetary advancement.
Econometrics theory was the GDP portion that was hit the hardest by the fiscal crisis in France and changed wander dove 9% in 2009. Taking after a ricochet back to 1.9% advancement in 2010, hypothesis has lamented starting now and into the foreseeable future and it contracted 0.8% in 2013. Moreover, France is a net shipper, in any case, the outside division littly affects the economy (Ciccone & Jarociński, 2010).
Quickly, organizations are
the guideline benefactor to France’s economy, with more than 70% of GDP
originating from this section. Immense subdivisions of organizations join the sparing
cash and budgetary, security and tourism parts. Creating speaks to somewhat
more than 10% of France’s GDP and France is an overall pioneer in the avionics,
auto and lavishness stock undertakings (Ciccone
& Jarociński, 2010). Disregarding the way that agriculture speaks to around 2%
of French GDP, it is seen as a fundamental industry in France and is frequently
the beneficiary of government gifts or protectionist plans (Facchini & Melki, 2013).
Econometrics – How well the country has managed to achieve the four macroeconomic objectives of high and stable economic growth, low unemployment, low inflation and avoidance of large balance of trade deficit.
There is a run of the mill
see, as regularly as could be expected under the circumstances watched or
reported by different economists is that France has a unique approach to her
economy and operations. In fact, France is delineated as a something close to a
revolt economy, where institutions and different staffs are in frequent strikes
especially on matters that affect them collectively (Ciccone & Jarociński, 2010).
Like most myths, the
intellectual economy myth – , in light of current conditions, executed by
people with a grievance, or by people who have visited the country due to
either economic interest or their personal interests. Different economic
overviews or rather arguments have come up and each shows different result from
the previous For each one of its deficiencies – and its qualities – however,
all the economists tend to concur that France economy is healthy and well
performing above average especially when compared with the G20 terms (UKDS, 2016).
Changing France is to an unprecedented degree troublesome to the time when some are imparting that nothing not another French resistance is required. According to a 2013 econometrics report by IMF, Hollande government was aiming to to cut down different demands by the French economy (Facchini & Melki, 2013); however this was qualified by a notice that more should be done to cut open spending, instead of raise responsibilities. Hollande has vowed to go basic on costs, to forsake putting any further un-convincing weight on French industry (Sly & Weber, 2016).
The failure of changing the
current situation in France, has become one of the primary challenge that is
undermining the country from attaining effective budgetting (Facchini & Melki, 2013); However, the approach that the government have left
many economists talking, for instance, a 2013 report argued the following
statements in regard to the France government.
a) The working hours in most
businesses located in France are mostly shorter than the time that European
countries work. For instance, when in Germany the average working hours per
year are 1904 while in France they are 1679.
b) Most employees in France
retire earlier than employees in Germany, the typical retirement age in Germany
is 62.3 while in France it is 60.3 and 64 in the United Kingdom.
c) In France, the employees
take many events, and holidays off work than employees in Germany and UK do,
specifically they take 7 days more than Germans do and 36 days more than
British employees do. However, despite all the fact, the France economy remains
competitive (UKDS, 2016).
One of the fundamental
issues identified with France’s work markets is unmistakable and interminable
business district that affiliations end up in when they endeavor to end a man
from staff. Many say the fear of putting in two years in a business tribunal is
a colossal execute for all the more little affiliations, who are in this way
more slanted to spread brief contracts instead of persevering ones. While
attempting to settle this Hollander will ensure to past what many would
consider workable for a laborer to hold up a disagreeing of out of line
dismissal, which starting now remains at two years after they were surrendered.
In an offer to urge boss to
contract more staff, Hollande game-plans to offer a “securing prize”
to self-representing endeavors. The course of action is to give some place
among 1,000 euro and 2,000 euro for every power who is chosen with a
remuneration of up to 1.3 times the national scarcest wage. The show is
kick-start shrinking by adjusting the gathering coordinated wander holds
commitment costs that may startle away executives, with Hollande’s party as to
it to be much speedier than changing France’s social obligation laws for low
paid labourers (Sly & Weber, 2016).
The report released by the
business serve in France exhibited that the strategy approaches will target
low-talented authorities, and will especially focus on change divisions, for
instance, mechanized and environment. The spending strategy for plan has been
connected by 80 million euro in 2016.
The present year’s measures
will cost €2 billion, which the mister of reserve said would be
“reimbursed in full” by meander holds from elsewhere. Hollande
ensured that the measures would not be financed by cost rises.
A blend of fitting optional
measures and altered stabilizers has padded the effect of the emergency. The
meander force diminishment presented in the 2010 spending course of action is
comparably welcome, yet extra spending ought to now be confronted. Laying out
and plainly passing on a significant multiyear leave system is a need. The
required solidifying addresses a chance to re-adjust open funds by cutting
wasteful spending, developing legacy, property and carbon strengths and
progress changing the favourable circumstances framework.
Identify and critically analyse 3 economic/political/demographic trends (Econometrics) that the country is experiencing and what the implications of these trends could be in the future.
Demographic trends in France
In 2030, the number of
inhabitants in France will achieve 67.9 million, an expansion of 5.8% from 2015
(UKDS, 2016). Moderately high, yet declining, birth and ripeness
rates, close by positive net movement, imply that France’s populace will build
speedier and age slower than most nations in Western Europe in 2015-2030.
France is a standout amongst the most urbanized nations in Western Europe and
this will keep on being the situation in 2030 when 91.8% of its aggregate
populace will be comprised of urban occupants.
The long haul
steadiness of richness and birth rates (right around 800,000 yearly births,
regardless of slight falls in 2011 and 2012) implies that the base of the French
populace pyramid is still very expansive (Baltagi,
2011)While
characteristic increment is still unmistakably positive, the maturing procedure
is reflected in a rising number of yearly passing’s as the populace with the most astounding
dangers of biting the dust becomes bigger.
The diminishing
in first social unions is measured by the entire of rates (total first marriage
rate) or the general probability of first marriage. Some place around 1972 and
2012, the total first marriage rate tumbled from 91.7 to 46.6 first social
unions for each 100 men and from 94.8 to 47.5 first social unions for every 100
women (Baltagi, 2011). Probability data show a
strong decrease in the degree of social unions between never-married
individuals up to age 50: it tumbled from 90 first social unions for each 100
never married men in 1972 to 53.5 in 2012, and from 93.4 first social unions
for every 100 never-married women to 56.3 for that years
(i) Estimate
the consumption function for your chosen country and comment on your results
Yt = a + bXt
Where
Yt is aggregate consumption of the country in year t;
Xt
is aggregate income (GDP) of the country in year t;
a is the
linear intercept and b is the
slope coefficient
[Note Aggregate Consumption (Y) = GC + PC
(government consumption expenditure plus Household consumption expenditure)
(Year 2015)
Y =
23.9 + 07
= 24.6
(ii) Write the estimated
regression equation and comment on the results of the regression analysis
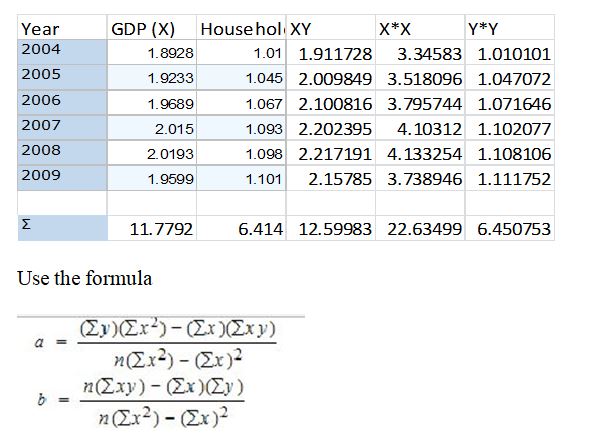
Taking values from the graph, we make a table consisting values of the recent 5 years (Excel Sheet below)
Econometrics Data
Use the formula
Where a=a and b
= b
a = -138.67
b =-515.123n
Insert the values in the equation
Yt = -138.67 – 515.123 Xt
(iii)
Calculate the confidence interval for b at 95% confidence interval.
-512 * (1 – 0.95)
CI = 25.6
(iv)
Test the statistical significance of b
Exposes
the error index
CI
– Y
25.6
– 24.6
=
1.0
(v)
Test the statistical significance of the model
The values are close to the mean
of X have less leverages that outliers towards the edges.
(vi) Identify whether the error
terms of the model are autocorrelated and/or heteroskedastic.
The error was auto-correlated, with 1.00 error index, which was explained by the value estimation and rounding off
References
Baltagi, B. (2011). Econometrics (1st ed.). Berlin: Springer.
Ciccone, A. & Jarociński, M. (2010). Econometrics & Determinants of Economic Growth: Will Data Tell?. American Economic Journal: Macroeconomics, 2(4), 222-246.
Facchini, F. & Melki, M. (2013). Efficient government size: France in the 20th century. EconometricsEuropean Journal Of Political Economy, 31, 1-14.
Sly, N. & Weber, C. (2016). Bilateral Tax Treaties, Econometrics and GDP Co-movement. Review Of International Economics.
UKDS,. (2016). Econometrics UKDS. Stat Metadata Viewer
Did you find any useful knowledge relating to Econometrics in this post? What are the key facts that grabbed your attention? Let us know in the comments. Thank you.
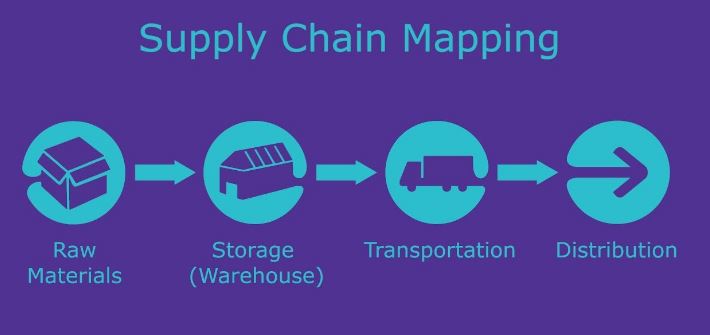
Supply Chain Mapping is crucial to any organisation regardless of its size, specialization or region. A typical supply chain system is composed of resources, activities that facilitate the movement of products from the supplier to the client and vice versa, i.e., upstream and downstream (Kozlenkova et al., 2015). However, the keeping track of all these supply chain activities, i.e., delivery and supply of necessary materials, information and other elements is getting complicated day by day.
Henceforth, it’s essential for organizations to manage these activities through visualizations which can help in identifying supply risk factors for necessary actions to be taken (Ho et al., 2015). And this is where supply chain mapping comes in handy. Supply chain mapping refers to the use of visual maps in monitoring the activities linking suppliers and customers. The supply chain map shows how all partners and actions are connected such as supply, transport, warehousing, retailing and so on.
Moreover, a supply chain map takes into account the transactions and information exchanged by all parties, both upstream and downstream (Jayaratane et al., 2018). Breaking down the composition of the supply chain mapping reveals interesting factors such as how it’s mapped, parts that are included in the map and criteria used to select. This paper thus discusses these elements of supply chain mapping in addition to the implications of various types of integration in the supply chain management.
Supply Chain Mapping Deployment
Mapping is meant
to reveal opportunities and obstacles so that an organization can be able to
formulate a winning strategy. To do so, a supply chain map has to indicate two
crucial components; the supply chain flow and supply chain entity (Dujak,
2017). This can be achieved by following these steps.
Mapping the Physical Structure
An existing supply
chain model already has physical locations that contribute to its value stream.
These include the warehouses, factories and retail stores that support the
movement of products and services upstream. However, the networks that support
that these facilities can be at times complex, even for established
organizations. For instance, it may be hard determining who supplies to the
organization’s suppliers.
Which facilities or methods do suppliers or producers use to ensure that the raw materials are produced legally and ethically? This requires an organization to step up its involvement by in its analysis of supply chain structure. Nuss et al., (2016) claims that identifying the relevant physical structures during mapping helps in determining the degree centrality of the supply chain.
Degree centrality is used to determine the level of physical sites that a particular organization owns. This, in turn, determines how the level of control they have on the supply chain and associated risks.
Networking Environment and Context Analysis
The environment
that a company operates comes in handy in understanding the supply network
system that they can tap into. Rodriguez
(2016) claims that this stage of supply chain mapping entails determining four
different types of ties: similarities, relations, interactions and flows. These
elements affect how a company is perceived by the society that it operates in.
For companies to
successfully succeed in this state, they should take into consideration factors
such as;
Cultural and ethnic
differences,
The geography covered,
Politics and legal systems
within the target markets,
Expectations of the end users.
The environmental protection
laws.
A company that
understands these factors will experience more success since it will be able to
determine the trends, the drivers and conditions that affect the flow of goods
and service both upstream and downstream.
An organization
should consider any unique factors which present in the supply chain to
determine if they are risks, threats or opportunities. This affects how the
organization responds (Rodriquez, 2016). For instance, an organization can
critically analyze:
Whether to standardize or
customize the products:
The complexity of the products
Customer tastes and preferences
Bureaucracy and complexity
within the organization
Cost of switching for customers
The degree of Competition in
the market.
All of these factors affect the type of supply chain an organization selects. The more complex and customized the products are, the more complex the supply chain will be.
Supply Chain Mapping
Considering the Buying Process:
This organization must consider how many hands the raw material or finished product pass through before reaching them or their target client respectively. For instance, the company should determine if it buys the products directly from the producers, or from brokers and third-party companies. To do so, a chart is created, showing how the current transactions and exchange of products are carried out in the supply chain. From this, the organization can determine which parties that they can away with to loosen up the supply chain model.
Dujak (2017) claims this part of the analysis can be classified under the extended value supply map. Brokers and re-suppliers can at times be adding no value to the whole production process, especially if the main producers of raw materials are within reach. In addition to hoarding products and inflating prices, brokers may also become unreliable parties when transacting with them. For instance, if products are not delivered on time despite being paid for, should you hold the broker or the producer accountable?
Can you eliminate the broker and purchase directly from the producer or supply directly to the final clients? Analyzing these elements will help determine how to approach non-value adding-component of the supply chain such as bypassing them.
Supply Chain Mapping – Accounting for Transparency of Information
Mapping a successful supply chain model entails ensuring that the information being passed across the various parties is consistent and credible. For this reason, a company has to define the types of reports that it expects from all the actors in the supply chain. The expectations will be based on the type of contract that an organization has with these parties.
The suppliers should provide information on their production process and their transport mechanisms (Gardner et al., 2015). Passing information on sample products or services ensures that expected standards have been met before the commercial production start. In this case, the information being passed down or up the stream covers concepts such as order status, product testing and such. There two ways of ensuring consistency information flow, i.e., manually or electronically.
Moreover, each actor should be provided on information about their expected roles and limitations (Gardner et al., 2015). When all these factors are considered, the supply chain mapping will be based on the transparent information. This implies that each of the party will be accountable and responsible for any issues that they are expected to handle. This stage is usually called the current state map.
Should the map include connected firms or primary firms?
The supply chain map mandates that every activity within the supply model must be accounted for. In doing so, the visualization of how the raw materials are produced to how they reach the final customer must be accounted. Henceforth, this takes into account all the primary and secondary activities that facilitates this process. For this reason, it’s essential to include the connected firm in the supply chain map
Means of determining who should be part of the supply
chain map
Heat mapping:
This method
entails identifying the main company priority regarding the products that it
produces. Each activity of the firm is assigned a grade/ colour/size in the
order of its overall importance to a company. In doing so, the company can be
able to trace the main parties behind such activity. The parties that become
part of the supply chain are those whose roles are found to be invaluable to
the company, i.e. those whose grades are much higher (Bryan, 2015). Regarding this, the supplier of a company has
a high priority since the raw materials that they provide; facilitate normal
running activities within the firm.
The degree of Risk:
Oliveira et al., (2017) claim the supply chain activities are proliferated with operational threats due to uncertainty in business environments. Such threats can lead to immense losses for a firm. For instance, Boeing suffered a loss of $2.25 Billion, while Cisco lost $2.25 Billion due to supply chain problems (Oliveira et al., 2017). Henceforth, when considering who to include in the supply chain, the main question should be if the party selected is ready to partake in the losses due to risks?
Secondly, how can the party help in mitigating risk? How accountable is the party in the organisational objectives? If a party feels the wrath of consequences related to risks and threats, then they should be included in the supply chain map.
Florian et al.,
(2015) break down this concept by assigning each risk category with the
composition of risks that may proliferate it. All of these activities have a
domino effect on the whole supply chain, any parties supplying these activities
must be included in the supply chain map.
Production Risk: Equipment
failure, overproduction, poor quality outputs (Florian et al., 2015).
From the above,
it’s evident that these are high-risk issues that may face an organization. Henceforth,
an organization should monitor all activities carried out by these parties to
ensure everything goes as planned. Moreover, when an issue arises, it can be
easy for the organization to track through the use of an already established
supply chain map. Henceforth, under this criteria, the supplier, the transporters,
warehousing companies and marketing agencies must be included in the supply
chain map.
Benchmarking
If a company wants to have a successful supply chain, it must study its competitors or other companies who have established a successful supply chain model. This is where benchmarking comes in handy where a company studies the processes, performances and products from the best practices (Routroy et al., 2015). This strategy helps a company select the right partners for its supply chain model, who are more likely to help it achieve its objectives fast.
Hettiarachchi (2016) claims that Apple Inc. has probably the most successful supply chain strategy due to how it has mastered mapping and visualization technologies in monitoring the movement of all products, both upstream and downstream. Once the company has benchmarked other companies supply chain maps, it then decides on how it can visualize its map for maximum benefits. The bigger the firm and the more complex its activities, it might find itself integrating even the secondary parties to the map, just like Apple Inc does (Hettiarachchi, 2016). On the other hand, if the company activities are just simple and use basic raw materials, its supply chain map should include the basic parties, i.e. supplier, warehouses, the firm, and the retailers.
The Importer-Exporter Criteria
The Importer (Buyer): This is a connected firm who supplies to the
organization supplier. The importer is usually the source of goods within that
region if he got them from the foreign nations. The importer negotiates
purchase terms with the main supplier, which affects the final price of the raw
materials when the reach a firm. This
party offloads and inspects the shipment to ensure that all the products that
had been ordered are in place. This importer is categorized as a source to pay
(S2P) within the supply chain map.
Supplier (Exporter): Usually categorized as an Order-to-Cash Component
in the Supply chain map. The exporter
receives the purchase order from company clients and validates their
credentials. After confirming the order,
they fulfill their services by shipping the goods to the clients. He then
collects the payment from the clients and reconciles them for analysis. The
reason the exporter is accounted for in the Supply chain map is that he can
help a company determine the level of demand from customers. The exporter is a
connected firm within the supply chain model.
Exporter (Supplier): This type of exporter falls under the connected
firm category and is a Fulfill-to service component. This supplier is in charge of fulfilling the
order of all the raw materials scheduled for production. The exporter procures
materials from their direct sources and delivers them to the company for
processing. This type of exporter is placed in the Fulfill-to-service
component.
Implications of a Good Supply Chain Management Practice
Vertical Structure:
More Control: Under this
arrangement, the company control major activities within its supply chain, e.g.
Apple Inc. As a result, the company can
make amendments or any changes in the supply chain with minimal tussles
(McCandless et al., 2015). For instance, when a manufacturer acquires its
product retailers, he can be able to dictate the prices of all the products,
just like he would if he were to acquire the supplier. As a result, they may
have more bargaining company than the customers’ especially if there are no
alternatives.
Differentiation:
Having more control over the distribution
channels, retails outlets, production materials inputs can enable a company to
distinguish itself from competitors. Consumers may be able to notice these
differences which can be leveraged upon further by clever marketing tactics.
Higher Profit and Revenue margins: Upstream and Downstream markets such as selling products to the
customers or accessing raw materials directly from the source may become new
sources of revenues. For instance, a
company can also supply raw materials or provide transport and warehouse facilities
to other companies on a fees basis. Moreover, having access to these elements eliminates
middlemen and intermediaries who usually hike the prices by the time the
products are reaching the company or end users. Henceforth, eliminating these
intermediaries implies all these profits they were enjoying will be redirected
to the firm.
Higher Level of Certainty: Florian et al., (2015) claimed that the more the parties involved in
the supply chain, the higher the risks due to reduced control the company may
have in overseeing all the activities. With vertical integration, all the
acquired companies are acting as subsidiaries to the main company; hence it may
be easy to standardize products and regulate their quality. This implies that a
company is guaranteed of quality raw materials, quality freight and transport, warehousing
and even retailing of goods.
Supply Chain Mapping Horizontal Integration
Market
Expansion: Horizontal
integration refers to the process of acquiring business activities that are at
the same level. For instance, a fast-food company can try to gain a footing in
another country by merging with another fast-food company in that nation. This
enables a company to have a larger market share, which in turn leads to more
revenues and profits for a company. The supply
chain model also becomes flexible and loosens up, since they can experiment
with different supplier simultaneously to determine the best one.
Industry
Control: the
merging of two similar businesses implies that their bargaining power also
increases. As a result, they can use this power to set the market prices for
their products, set standards for customers as well as dictate the quality they
expect from their suppliers and prices.
This is an immense power which may lead to more third-party
vendors focusing more on such companies due to being assured of continuous
contracts and high demand for their goods.
Economies
of Scale: An
integrated company will be able to order quantity raw materials, engage in more
productive activities at a much lower cost than if it were ordering low
quantity products. This may in turn,
lead to bigger profit margins and optimal use of all the facilities within the
company.
Increased
Differentiation: if the company continues acquiring and merging with
businesses along with all lines it operates in, it can have more control over
the features of its products. For
instance, the products may be either cheaper, high quality, long lasting in a
way that other companies which have not integrated themselves cannot replicate.
Focal Company:
Better relations with consumers: Under this structure, the company has a direct contract with the
end users (Wang et al., 2016). This may help the company gain more trust and
loyalty, leading to repeat sales from customers.
Better insight for better marketing and product
strategies: The company taps to first-hand
information from clients from matters about complains, suggestions that they
may have on the type of services provided. The company may use this information
to re-align and strategize itself so that it meets their demand or needs
adequately.
Increased Accountability of suppliers and
distributors: Since the company has contact with
the end user, it may also provide guidelines that their vendors should follow
to provide the best quality services and products for their customers. This may
lead to the company monitoring the activities within the supply chain more
closely than with other forms of integration (Wang et al., 2016). This may lead
to a domino effect where the suppliers and other service providers to the
company are also more keen, leading to quality products in the end.
In conclusion, it’s evident that supply chain mapping is very crucial for companies. It supports information distribution, shows channel dynamics and enhances strategic planning process for an organization. This enables the company can track all activities. It helps companies get more insight on all activities that are crucial to its functioning, be it upstream or downstream.
How can a supply chain mapping be successful? Well, the answer lies in who is the parties that are included in the map, criteria used to select them and their contribution to overall organizational goals It’s also worth noting that the supply chain map will be dependent on the type of integration that a company uses in its acquisition and delivery of goods/services, both upstream and downstream.
References
Dujak, D. (2017,
January). Mapping of natural gas supply chains: Literature Review. In 17th International Scientific Conference Business
Logistics in Modern Management 2017.
Florian, G. L., & Constangioara, A. (2014).
The impact of risks in supply chain on organizational performances: evidence
from Romania. Series
Economy Management, 17(2), 265-275.
Gardner, T. A.,
Benzie, M., Börner, J., Dawkins, E., Fick, S., Garrett, R., … & Mardas,
N. (2018). Transparency and sustainability in global commodity supply
chains. World Development.
Hettiarachchi, H. (2016). Apple’s Supply Chain Strategy.
10.13140/RG.2.2.32075.49448.
Ho, W., Zheng,
T., Yildiz, H., & Talluri, S. (2015). Supply chain risk management: a
literature review. International
Journal of Production Research, 53(16), 5031-5069.
Jayaratne, P., Styger, L., & Perera, N. (2018). Role Of Supply Chain Mapping In Sustainable Supply Chain Management. 2nd International Conference on Management Proceeding.
Kozlenkova, I., Hult, T., Lund, D., Mena, J., & Kekec, P. (2015). The Role of Marketing
Channels in Supply Chain Management. Journal of Retailing. 91.
10.1016/j.jretai.2015.03.003.
Bryan, C. (2015). Handbook of Research on Global Supply Chain Management. IGI Global. ISBN-10: 1466696397
Mccandless, E., Abitbol, E., & Donais, T.
(2015). Vertical integration: A dynamic practice promoting transformative
peacebuilding. Journal of Peacebuilidng and Development. 10(1).
Nuss, P.,
Graedel, T. E., Alonso, E., & Carroll, A. (2016). Mapping supply chain risk
by network analysis of product platforms. Sustainable Materials and Technologies, 10, 14-22.
Rodríguez, R. R.
(2016). Social network analysis and supply chain management. International Journal of Production Management
and Engineering (IJPME), 4(1), 35-40.
Routroy, S., & Shankar, A. (2015). A
benchmarking approach for supply chain risk management. International
Journal of Services and Operations Management, 20(3), 338-357.
Supply Chain Mapping Protocol. (2017). Supply Chain Sustainability. Version 1.
Wang, X. & Wood, L.C. (2016). The Influence of Supply Chain Sustainability Practices of Suppliers.
If you enjoyed reading this post on Supply Chain Mapping, I would be very grateful if you could help spread this knowledge by emailing this post to a friend, or sharing it on Twitter or Facebook. Thank you.
Title: Cross-Border Mergers – Mergers are business transactions that happen between two companies where one takes over entirely or part of the other business. Cross-border mergers are mergers that take part between companies from different countries or nationalities. Cross-border mergers can be classified as either inward or outward; the former occurs where a foreign company acquires a domestic company and the latter occurring when an international company is wholly or partly purchased. These cross-border mergers have been on the rise since the 1990s and are increasingly taking place in different industries. Typical industries that these cross-border mergers take place include the pharmaceutical, automotive as well as telecommunications sector.
Cross-border
mergers are a strategy for companies to expand into markets that they think are
profitable and are a vital key to the success of their products and services.
But due to the international aspect of these mergers, various challenges face
the companies involved for example the difference in economic, cultural and
institutional aspects and these can be a major impediment to the success of
these mergers.
An example of a failed cross-border merger is the merger between Daimler-Benz from Germany and Chrysler from the United States of America. This merger took place in 1998, and the result was the formation of Daimler-Chrysler Company. This merger was viewed as the union of two great automotive companies but sadly it was not a success (Rosenbloom, 2010). Looking into the reasons for the failure of this cross-border merger, several issues can be found to be the reason behind its failure. One of the key reasons behind the failure of the merger was the cultural difference between the two countries.
The German cultures were seen to be the most dominant in the company, and this led to the satisfaction of employees at Chrysler who were predominantly American to drop off. This cultural mismatch is seen to be the main reason behind the failure of this merger and nine years late Chrysler was sold off to Cerberus Capital Management after a string of losses and employee layoffs.
Another reason behind the failure of the cross-border merger between Daimler and Chrysler was the differences between the two companies’ operating styles. The organizational structure implemented at Daimler was a tiered organization that had a clear chain of command and respect for authority. This structure was a direct contrast to the approach at Chrysler that implemented a team-oriented and open plan (Pervaiz, M., and F. Zafar, 2014).
The result was a lack of harmony as well as opposing work styles between the German and American managers at the company. It can be seen that since Daimler was the one that took over Chrysler, it tried running the American company’s operations just like it was doing in Germany (Appelbaum, Roberts, and Shapiro, 2013). If this issue was to be avoided, a focus on the different organizational culture should have been carried out so as to define the various management styles, the similarities as well as the differences and tried to come up with a common ground that could be implemented in the merger.
Cross-Border Mergers
To summarize the
key factors behind the failure of the merger between Daimler-Benz and Chrysler,
it can be deduced that the following three issues were behind it all:
Corporate
cultural differences and values
Lack
of trust between employees
Different
organizational structures leading to a lack of coordination between the employees.
According to Qiu (2010) the failure of the Daimler-Chrysler merger had far-reaching financial implications and was a disappointment to what would have been one of the most successful mergers of all time. If this merger had worked out, the company would have had a significant stronghold on the automotive market making it one of the largest automakers in the world and giving it super profits and access to a vast customer base. The competitive advantage that stood to be gained by this merger would be second to none, but this was never to be.
This benefit would have been achieved by the design and production of joint projects by the two companies instead of still competing in the market as separate entities, yet they were from one stable. The merger would have been handled better by focusing on the general issues facing the companies and not the cross-border problems that led to the discontent displayed by the two. Integration workshops would have also been held in a bid to ease the cultural integration between the two companies as well as orient the employees to the new corporation corporate strategy
The result of
this failed merger was a lesson to other businesses that would be having the
plan to take part in cross-border mergers.
Bibliography
Appelbaum, Steven H., Jessie Roberts, and
Barabara T. Shapiro. “Cultural strategies in M&As: Investigating ten
case studies.” Journal of
Executive Education 8, no. 1
(2013): 3.
Rosenbloom, Arthur H., ed. Due diligence for global deal
making: the definitive guide to cross-border mergers and acquisitions, joint
ventures, financings, and strategic alliances. Vol. 8. John Wiley &
Sons, 2010.
Qiu, Larry D. “Cross-border mergers and
strategic alliances.” European
Economic Review 54, no. 6
(2010): 818-831.
Pervaiz, M., and F. Zafar. “Strategic
Management Approach to Deal with Mergers in the era of Globalization.” International Journal of
Information, Business and Management 6,
no. 3 (2014): 170.
Did you find any useful knowledge relating to cross-border mergers in this post? What are the key facts that grabbed your attention? Let us know in the comments. Thank you.