Supply Chain Mapping MBA Project

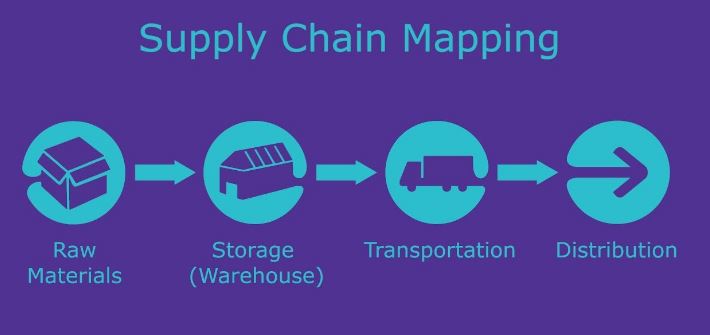
Supply Chain Mapping is crucial to any organisation regardless of its size, specialization or region.  A typical supply chain system is composed of resources, activities that facilitate the movement of products from the supplier to the client and vice versa, i.e., upstream and downstream (Kozlenkova et al., 2015). However, the keeping track of all these supply chain activities, i.e., delivery and supply of necessary materials, information and other elements is getting complicated day by day.

Henceforth, it’s essential for organizations to manage these activities through visualizations which can help in identifying supply risk factors for necessary actions to be taken (Ho et al., 2015). And this is where supply chain mapping comes in handy. Supply chain mapping refers to the use of visual maps in monitoring the activities linking suppliers and customers.  The supply chain map shows how all partners and actions are connected such as supply, transport, warehousing, retailing and so on.

Moreover, a supply chain map takes into account the transactions and information exchanged by all parties, both upstream and downstream (Jayaratane et al., 2018).  Breaking down the composition of the supply chain mapping reveals interesting factors such as how it’s mapped, parts that are included in the map and criteria used to select. This paper thus discusses these elements of supply chain mapping in addition to the implications of various types of integration in the supply chain management.

Supply Chain Mapping Deployment

Mapping is meant to reveal opportunities and obstacles so that an organization can be able to formulate a winning strategy. To do so, a supply chain map has to indicate two crucial components; the supply chain flow and supply chain entity (Dujak, 2017). This can be achieved by following these steps.

Mapping the Physical Structure

An existing supply chain model already has physical locations that contribute to its value stream. These include the warehouses, factories and retail stores that support the movement of products and services upstream. However, the networks that support that these facilities can be at times complex, even for established organizations. For instance, it may be hard determining who supplies to the organization’s suppliers.

Which facilities or methods do suppliers or producers use to ensure that the raw materials are produced legally and ethically? This requires an organization to step up its involvement by in its analysis of supply chain structure.  Nuss et al., (2016) claims that identifying the relevant physical structures during mapping helps in determining the degree centrality of the supply chain.

Degree centrality is used to determine the level of physical sites that a particular organization owns. This, in turn, determines how the level of control they have on the supply chain and associated risks.

Networking Environment and Context Analysis

The environment that a company operates comes in handy in understanding the supply network system that they can tap into.  Rodriguez (2016) claims that this stage of supply chain mapping entails determining four different types of ties: similarities, relations, interactions and flows. These elements affect how a company is perceived by the society that it operates in.

For companies to successfully succeed in this state, they should take into consideration factors such as;

  • Cultural and ethnic differences,
  • The geography covered,
  • Politics and legal systems within the target markets,
  • Expectations of the end users.
  • The environmental protection laws.

A company that understands these factors will experience more success since it will be able to determine the trends, the drivers and conditions that affect the flow of goods and service both upstream and downstream.

An organization should consider any unique factors which present in the supply chain to determine if they are risks, threats or opportunities. This affects how the organization responds (Rodriquez, 2016). For instance, an organization can critically analyze:

  • Whether to standardize or customize the products:
  • The complexity of the products
  • Customer tastes and preferences
  • Bureaucracy and complexity within the organization
  • Cost of switching for customers
  • The degree of Competition in the market.

All of these factors affect the type of supply chain an organization selects. The more complex and customized the products are, the more complex the supply chain will be.

Supply Chain Mapping

Considering the Buying Process:

This organization must consider how many hands the raw material or finished product pass through before reaching them or their target client respectively.  For instance, the company should determine if it buys the products directly from the producers, or from brokers and third-party companies.  To do so, a chart is created, showing how the current transactions and exchange of products are carried out in the supply chain. From this, the organization can determine which parties that they can away with to loosen up the supply chain model.

Dujak (2017) claims this part of the analysis can be classified under the extended value supply map. Brokers and re-suppliers can at times be adding no value to the whole production process, especially if the main producers of raw materials are within reach. In addition to hoarding products and inflating prices, brokers may also become unreliable parties when transacting with them. For instance, if products are not delivered on time despite being paid for, should you hold the broker or the producer accountable?

Can you eliminate the broker and purchase directly from the producer or supply directly to the final clients? Analyzing these elements will help determine how to approach non-value adding-component of the supply chain such as bypassing them.

Supply Chain Mapping – Accounting for Transparency of Information 

Mapping a successful supply chain model entails ensuring that the information being passed across the various parties is consistent and credible. For this reason, a company has to define the types of reports that it expects from all the actors in the supply chain. The expectations will be based on the type of contract that an organization has with these parties.

The suppliers should provide information on their production process and their transport mechanisms (Gardner et al., 2015).  Passing information on sample products or services ensures that expected standards have been met before the commercial production start. In this case, the information being passed down or up the stream covers concepts such as order status, product testing and such. There two ways of ensuring consistency information flow, i.e., manually or electronically.

Moreover, each actor should be provided on information about their expected roles and limitations (Gardner et al., 2015). When all these factors are considered, the supply chain mapping will be based on the transparent information. This implies that each of the party will be accountable and responsible for any issues that they are expected to handle. This stage is usually called the current state map.

Should the map include connected firms or primary firms?

The supply chain map mandates that every activity within the supply model must be accounted for. In doing so, the visualization of how the raw materials are produced to how they reach the final customer must be accounted. Henceforth, this takes into account all the primary and secondary activities that facilitates this process. For this reason, it’s essential to include the connected firm in the supply chain map

Means of determining who should be part of the supply chain map

Heat mapping:

This method entails identifying the main company priority regarding the products that it produces. Each activity of the firm is assigned a grade/ colour/size in the order of its overall importance to a company. In doing so, the company can be able to trace the main parties behind such activity. The parties that become part of the supply chain are those whose roles are found to be invaluable to the company, i.e. those whose grades are much higher (Bryan, 2015).  Regarding this, the supplier of a company has a high priority since the raw materials that they provide; facilitate normal running activities within the firm.

The degree of Risk:

Oliveira et al., (2017) claim the supply chain activities are proliferated with operational threats due to uncertainty in business environments. Such threats can lead to immense losses for a firm. For instance, Boeing suffered a loss of $2.25 Billion, while Cisco lost $2.25 Billion due to supply chain problems (Oliveira et al., 2017). Henceforth, when considering who to include in the supply chain, the main question should be if the party selected is ready to partake in the losses due to risks?

Secondly, how can the party help in mitigating risk? How accountable is the party in the organisational objectives? If a party feels the wrath of consequences related to risks and threats, then they should be included in the supply chain map.

Florian et al., (2015) break down this concept by assigning each risk category with the composition of risks that may proliferate it. All of these activities have a domino effect on the whole supply chain, any parties supplying these activities must be included in the supply chain map.

Supplying Risks: Poor quality good, non-delivery of agreed products, inflated prices, delayed delivery schedule.

Transporting Risk: Loss and damage to good when in transit

Warehousing Risks: Spoiling and damage to goods; changes in storage costs and taxes being levied on them.

Marketing Risks: Wrong promotional strategies, excessive, demand volatility.

Production Risk: Equipment failure, overproduction, poor quality outputs (Florian et al., 2015).

From the above, it’s evident that these are high-risk issues that may face an organization. Henceforth, an organization should monitor all activities carried out by these parties to ensure everything goes as planned. Moreover, when an issue arises, it can be easy for the organization to track through the use of an already established supply chain map. Henceforth, under this criteria, the supplier, the transporters, warehousing companies and marketing agencies must be included in the supply chain map.

Benchmarking

If a company wants to have a successful supply chain, it must study its competitors or other companies who have established a successful supply chain model. This is where benchmarking comes in handy where a company studies the processes, performances and products from the best practices (Routroy et al., 2015).  This strategy helps a company select the right partners for its supply chain model, who are more likely to help it achieve its objectives fast.

Hettiarachchi (2016) claims that Apple Inc. has probably the most successful supply chain strategy due to how it has mastered mapping and visualization technologies in monitoring the movement of all products, both upstream and downstream. Once the company has benchmarked other companies supply chain maps, it then decides on how it can visualize its map for maximum benefits. The bigger the firm and the more complex its activities, it might find itself integrating even the secondary parties to the map, just like Apple Inc does (Hettiarachchi, 2016). On the other hand, if the company activities are just simple and use basic raw materials, its supply chain map should include the basic parties, i.e. supplier, warehouses, the firm, and the retailers.

The Importer-Exporter Criteria

The Importer (Buyer):  This is a connected firm who supplies to the organization supplier. The importer is usually the source of goods within that region if he got them from the foreign nations. The importer negotiates purchase terms with the main supplier, which affects the final price of the raw materials when the reach a firm.  This party offloads and inspects the shipment to ensure that all the products that had been ordered are in place. This importer is categorized as a source to pay (S2P) within the supply chain map.

Supplier (Exporter):  Usually categorized as an Order-to-Cash Component in the Supply chain map.  The exporter receives the purchase order from company clients and validates their credentials.  After confirming the order, they fulfill their services by shipping the goods to the clients. He then collects the payment from the clients and reconciles them for analysis. The reason the exporter is accounted for in the Supply chain map is that he can help a company determine the level of demand from customers. The exporter is a connected firm within the supply chain model.

Exporter (Supplier):  This type of exporter falls under the connected firm category and is a Fulfill-to service component.  This supplier is in charge of fulfilling the order of all the raw materials scheduled for production. The exporter procures materials from their direct sources and delivers them to the company for processing. This type of exporter is placed in the Fulfill-to-service component.

Implications of a Good Supply Chain Management Practice

Vertical Structure:

More Control: Under this arrangement, the company control major activities within its supply chain, e.g. Apple Inc.  As a result, the company can make amendments or any changes in the supply chain with minimal tussles (McCandless et al., 2015). For instance, when a manufacturer acquires its product retailers, he can be able to dictate the prices of all the products, just like he would if he were to acquire the supplier. As a result, they may have more bargaining company than the customers’ especially if there are no alternatives.

Differentiation:  Having more control over the distribution channels, retails outlets, production materials inputs can enable a company to distinguish itself from competitors. Consumers may be able to notice these differences which can be leveraged upon further by clever marketing tactics.

Higher Profit and Revenue margins: Upstream and Downstream markets such as selling products to the customers or accessing raw materials directly from the source may become new sources of revenues.  For instance, a company can also supply raw materials or provide transport and warehouse facilities to other companies on a fees basis. Moreover, having access to these elements eliminates middlemen and intermediaries who usually hike the prices by the time the products are reaching the company or end users. Henceforth, eliminating these intermediaries implies all these profits they were enjoying will be redirected to the firm.

Higher Level of Certainty: Florian et al., (2015) claimed that the more the parties involved in the supply chain, the higher the risks due to reduced control the company may have in overseeing all the activities. With vertical integration, all the acquired companies are acting as subsidiaries to the main company; hence it may be easy to standardize products and regulate their quality. This implies that a company is guaranteed of quality raw materials, quality freight and transport, warehousing and even retailing of goods.

Supply Chain Mapping Horizontal Integration

Market Expansion: Horizontal integration refers to the process of acquiring business activities that are at the same level. For instance, a fast-food company can try to gain a footing in another country by merging with another fast-food company in that nation. This enables a company to have a larger market share, which in turn leads to more revenues and profits for a company.  The supply chain model also becomes flexible and loosens up, since they can experiment with different supplier simultaneously to determine the best one.

Industry Control: the merging of two similar businesses implies that their bargaining power also increases. As a result, they can use this power to set the market prices for their products, set standards for customers as well as dictate the quality they expect from their suppliers and prices.

This is an immense power which may lead to more third-party vendors focusing more on such companies due to being assured of continuous contracts and high demand for their goods.

Economies of Scale: An integrated company will be able to order quantity raw materials, engage in more productive activities at a much lower cost than if it were ordering low quantity products.  This may in turn, lead to bigger profit margins and optimal use of all the facilities within the company.

Increased Differentiation: if the company continues acquiring and merging with businesses along with all lines it operates in, it can have more control over the features of its products.  For instance, the products may be either cheaper, high quality, long lasting in a way that other companies which have not integrated themselves cannot replicate.

Focal Company:

Better relations with consumers: Under this structure, the company has a direct contract with the end users (Wang et al., 2016). This may help the company gain more trust and loyalty, leading to repeat sales from customers.

Better insight for better marketing and product strategies: The company taps to first-hand information from clients from matters about complains, suggestions that they may have on the type of services provided. The company may use this information to re-align and strategize itself so that it meets their demand or needs adequately.

Increased Accountability of suppliers and distributors: Since the company has contact with the end user, it may also provide guidelines that their vendors should follow to provide the best quality services and products for their customers. This may lead to the company monitoring the activities within the supply chain more closely than with other forms of integration (Wang et al., 2016). This may lead to a domino effect where the suppliers and other service providers to the company are also more keen, leading to quality products in the end.

In conclusion, it’s evident that supply chain mapping is very crucial for companies. It supports information distribution, shows channel dynamics and enhances strategic planning process for an organization. This enables the company can track all activities.  It helps companies get more insight on all activities that are crucial to its functioning, be it upstream or downstream.

How can a supply chain mapping be successful? Well, the answer lies in who is the parties that are included in the map, criteria used to select them and their contribution to overall organizational goals It’s also worth noting that the supply chain map will be dependent on the type of integration that a company uses in its acquisition and delivery of goods/services, both upstream and downstream.

References

Dujak, D. (2017, January). Mapping of natural gas supply chains: Literature Review. In 17th International Scientific Conference Business Logistics in Modern Management 2017.

Florian, G. L., & Constangioara, A. (2014). The impact of risks in supply chain on organizational performances: evidence from Romania. Series Economy Management17(2), 265-275.

Gardner, T. A., Benzie, M., Börner, J., Dawkins, E., Fick, S., Garrett, R., … & Mardas, N. (2018). Transparency and sustainability in global commodity supply chains. World Development.

Hettiarachchi, H. (2016). Apple’s Supply Chain Strategy. 10.13140/RG.2.2.32075.49448.

Ho, W., Zheng, T., Yildiz, H., & Talluri, S. (2015). Supply chain risk management: a literature review. International Journal of Production Research53(16), 5031-5069.

Jayaratne, P., Styger, L., & Perera, N. (2018). Role Of Supply Chain Mapping In Sustainable Supply Chain Management. 2nd International Conference on Management Proceeding.

Kozlenkova, I., Hult, T., Lund, D., Mena, J.,  & Kekec, P. (2015). The Role of Marketing Channels in Supply Chain Management. Journal of Retailing. 91. 10.1016/j.jretai.2015.03.003.

Bryan, C. (2015). Handbook of Research on Global Supply Chain Management. IGI Global. ISBN-10: 1466696397

Mccandless, E., Abitbol, E., & Donais, T. (2015). Vertical integration: A dynamic practice promoting transformative peacebuilding. Journal of Peacebuilidng and Development. 10(1).

Nuss, P., Graedel, T. E., Alonso, E., & Carroll, A. (2016). Mapping supply chain risk by network analysis of product platforms. Sustainable Materials and Technologies10, 14-22.

Oliveira, U.R., Espindolar, L.S & Marims, S.F (2017). Analysis of supply chain risk management researches.

Rodríguez, R. R. (2016). Social network analysis and supply chain management. International Journal of Production Management and Engineering (IJPME)4(1), 35-40.

Routroy, S., & Shankar, A. (2015). A benchmarking approach for supply chain risk management. International Journal of Services and Operations Management20(3), 338-357.

Supply Chain Mapping Protocol. (2017).  Supply Chain Sustainability. Version 1.

Wang, X. & Wood, L.C. (2016). The Influence of Supply Chain Sustainability Practices of Suppliers.

Other Relevant Blog Posts

Supply Chain Management Business Success

How Sustainable Supply Chain Management Can Increase Sales In Fashion Clothing. A Study of Marks and Spencer

If you enjoyed reading this post on Supply Chain Mapping, I would be very grateful if you could help spread this knowledge by emailing this post to a friend, or sharing it on Twitter or Facebook. Thank you.

Cross-Border Mergers Business Strategy

Cross-Border Mergers – A Success or Not?

Title: Cross-Border Mergers – Mergers are business transactions that happen between two companies where one takes over entirely or part of the other business. Cross-border mergers are mergers that take part between companies from different countries or nationalities. Cross-border mergers can be classified as either inward or outward; the former occurs where a foreign company acquires a domestic company and the latter occurring when an international company is wholly or partly purchased. These cross-border mergers have been on the rise since the 1990s and are increasingly taking place in different industries. Typical industries that these cross-border mergers take place include the pharmaceutical, automotive as well as telecommunications sector.

Cross-border mergers are a strategy for companies to expand into markets that they think are profitable and are a vital key to the success of their products and services. But due to the international aspect of these mergers, various challenges face the companies involved for example the difference in economic, cultural and institutional aspects and these can be a major impediment to the success of these mergers.

An example of a failed cross-border merger is the merger between Daimler-Benz from Germany and Chrysler from the United States of America. This merger took place in 1998, and the result was the formation of Daimler-Chrysler Company. This merger was viewed as the union of two great automotive companies but sadly it was not a success (Rosenbloom, 2010). Looking into the reasons for the failure of this cross-border merger, several issues can be found to be the reason behind its failure. One of the key reasons behind the failure of the merger was the cultural difference between the two countries.

The German cultures were seen to be the most dominant in the company, and this led to the satisfaction of employees at Chrysler who were predominantly American to drop off. This cultural mismatch is seen to be the main reason behind the failure of this merger and nine years late Chrysler was sold off to Cerberus Capital Management after a string of losses and employee layoffs.

Another reason behind the failure of the cross-border merger between Daimler and Chrysler was the differences between the two companies’ operating styles. The organizational structure implemented at Daimler was a tiered organization that had a clear chain of command and respect for authority.  This structure was a direct contrast to the approach at Chrysler that implemented a team-oriented and open plan (Pervaiz, M., and F. Zafar, 2014).

The result was a lack of harmony as well as opposing work styles between the German and American managers at the company. It can be seen that since Daimler was the one that took over Chrysler, it tried running the American company’s operations just like it was doing in Germany (Appelbaum, Roberts, and Shapiro, 2013). If this issue was to be avoided, a focus on the different organizational culture should have been carried out so as to define the various management styles, the similarities as well as the differences and tried to come up with a common ground that could be implemented in the merger.

To summarize the key factors behind the failure of the merger between Daimler-Benz and Chrysler, it can be deduced that the following three issues were behind it all:

  • Corporate cultural differences and values
  • Lack of trust between employees
  • Different organizational structures leading to a lack of coordination between the employees.

According to Qiu (2010) the failure of the Daimler-Chrysler merger had far-reaching financial implications and was a disappointment to what would have been one of the most successful mergers of all time. If this merger had worked out, the company would have had a significant stronghold on the automotive market making it one of the largest automakers in the world and giving it super profits and access to a vast customer base. The competitive advantage that stood to be gained by this merger would be second to none, but this was never to be.

This benefit would have been achieved by the design and production of joint projects by the two companies instead of still competing in the market as separate entities, yet they were from one stable. The merger would have been handled better by focusing on the general issues facing the companies and not the cross-border problems that led to the discontent displayed by the two. Integration workshops would have also been held in a bid to ease the cultural integration between the two companies as well as orient the employees to the new corporation corporate strategy

The result of this failed merger was a lesson to other businesses that would be having the plan to take part in cross-border mergers.

Bibliography

Appelbaum, Steven H., Jessie Roberts, and Barabara T. Shapiro. “Cultural strategies in M&As: Investigating ten case studies.” Journal of Executive Education 8, no. 1 (2013): 3.

Rosenbloom, Arthur H., ed. Due diligence for global deal making: the definitive guide to cross-border mergers and acquisitions, joint ventures, financings, and strategic alliances. Vol. 8. John Wiley & Sons, 2010.

Qiu, Larry D. “Cross-border mergers and strategic alliances.” European Economic Review 54, no. 6 (2010): 818-831.

Pervaiz, M., and F. Zafar. “Strategic Management Approach to Deal with Mergers in the era of Globalization.” International Journal of Information, Business and Management 6, no. 3 (2014): 170.

Relevant Blog Posts

Management of Organisational Change

Does Merger and Acquisition Enhance Efficiency or Erode Company Wealth? A Study of the Tata Steel Acquisition of Corus

Did you find any useful knowledge relating to cross-border mergers in this post? What are the key facts that grabbed your attention? Let us know in the comments. Thank you.

Insider Trading University Essay

Insider Trading Ethical or Not?

Insider trading is malpractice that involves buying and selling stocks using information that is not available to the public. The practice gives some traders an unfair advantage over others, and it is a punishable crime. Insider trading is commonly found among the corporate officers or people who receive the non-public information. Traders are always tempted to carry out this malpractice to make more profits than others or avoid losses. This act is illegal, and the Securities and Exchange Commission usually investigates and prosecutes it. However, insider trading can be legal if the trading is done based on information that is available for public use. This papers aim is to discuss why insider trading is considered unethical and finding out if allowing insider trading would hinder the operation of the stock market in raising capital for new and existing companies.

Is Insider Trading Ethical?

Insider trading is unethical because it involves exploiting the knowledge that is only known to a few people. The insiders are usually given an unfair advantage that allows them to benefit from information of the stock market before the general public. These people get to exploit the opportunity before the rest making accumulative profits and avoid risks. Generally, insiders ought to maintain a fiduciary relationship with their companies and shareholders so when they try to benefit from the inside information puts their interest above the people they serve. The practice is unethical since the insiders are supposed to protect the interests of the entities they serve rather than using it to their advantage.

There are other times the people on the inside divulge the information to the people on the outside (Alldredge, 2015). The process involves a tipper and a whistle-blower, with the tipper being the person who divulges the information to the outsider and the tepee the receiver of the data. The whistle-blower then utilizes the information obtained to seek profits or avoid financial losses in the stock market. As much as the tippler may not benefit directly, it is still unethical since it makes some people gain unfair advantages over others.

In most cases, insiders are after personal gains at the expense of the investors and the company at large which is unethical. On moral grounds such as actions are unjust and are termed as a fraud. The investors feel unsafe and insecure to invest since they lose trust that they hold to the insiders.

Any interests in a stock market must look after the interests of all shareholders and not just favoring a few (Skaife, 2013). Generally, insider trading betrays investors’ trust; insiders act on data that is not available to shareholders for monetary gains, officers of a company are acting to satisfy their interests. The insider trading is an unethical practice and should be checked on and brought to a stop.

However, there some people who argue that insider trading is not a bad practice. Such people insinuate that insider trading allows for all the relevant data to be reflected in the shares’ price. The process makes the security it easy for investors to understand the costs before purchasing the shares (Alldredge, 2015).

In such situations, potential investors and current shareholders are able to make informed decisions on purchase and sale respectively.  Another argument is that barring the practice delays something that will eventually take place. Blocking investors from accessing the information on the price changes can subject them to buying or selling shares at losses which could have been avoided if the information had been available.

Insider Trading University Essay

Insider trading hinders the operation of the stock market in raising capital for the new and existing forms. Instances when a few people benefit from the stock’s information, investors lose trust in the company hindering them from participating in the activities of the stock market. The process leaves the stock markets with nowhere to gets funds consequently affecting the market’s ability to carry out its operations. Without the services then it becomes difficult for the stock markets to finance new or existing companies (Skaife, 2013).

Additionally, when insiders reveal security’s information to some people before the sales take place, the stock markets become integrated affecting the stocks prices. The stock market fails to exploit the pricing advantage since buyers already know what to expect. The process may cause the market to suffer losses making it difficult for the market to raise cash for other firms. Generally, insider trading is allowed to continue, and it can lead to many investors being driven away and avoiding the practice.

Insider trading affects general business management and decision making. Managers may make wrong on a particular situation using the inside information which is not reliable all the time. On top of that, insider information influences investor decisions impacting the stock’s market price or valuation. For example, when the investors are aware that the price of shares is going to drop they sell their shares in advance to avoid losses consequently impacting a firm’s stock valuation.

Conclusively, insider practice is an unethical practice since it favors some people over others. The people on the side get to exploit nonpublic information for their benefits at the expense of the investors. The investors lose trust in the whole process of stock exchange and with time they get driven away. The method may leave the stock exchange market with funds that are needed to finance upcoming and existing companies. Insider trading is unfair and unethical since it involves lying to the investors and should be stopped to avoid negatively affecting the economy.

References

Alldredge, D. M., & Cicero, D. C. (2015). Attentive insider trading. Journal of Financial Economics, 115(1), 84-101.

Skaife, H. A., Veenman, D., & Wangerin, D. (2013). Internal control over financial reporting and managerial rent extraction: Evidence from the profitability of insider trading. Journal of Accounting and Economics, 55(1), 91-110.

Relevant Blog Posts

Business Management Essays

Business Management Strategies

Did you find any useful knowledge relating to Insider Trading in this post? What are the key facts that grabbed your attention? Let us know in the comments. Thank you.

Stock Market Crash Global Financial Crisis

Analysis of the Stock Market Crash and Global Financial Crisis

The stock market crash in the autumn of 1987 is labeled as one of the sharpest markets down in history. Stock markets around the world plummeted in a matter of hours. The Black Monday, as it is labeled, is market as one of the major contemporary global financial crisis after the great depression that hit the global market between 1929 and 1941 (Markham, 2002). In the US, the stock market crash was marked by the 22.6 percent drop in a single trading session of the Dow Jones Industrial Average (DJIA).

In the years leading up to the stock market crash on October 19, 1987, there was an extension of a continuation of a highly powerful bull market. At this period, running from 1982, the market had started to embrace globalization and the advancement in technology. In the years 1986 and 1987, the bull market was fueled by hostile takeovers, low-interest rates, leveraged buyouts and increased mergers (Bloch, 1989).

The business philosophy at the time encouraged exponential business growth by acquisition of others. At the time, companies used leveraged buyouts to raise massive amounts of capital to fund the procurement of the desired companies. The companies raised the capital by selling junk bonds to the public. The junk bonds refer to the bonds that pay high-interest rates by the virtue of their high risk of default. Initial public offering or IPO was another trend used to drive market excitement.

During that time of increased market activity, the US Securities, and Exchange Commission (SEC) found it extremely hard to prevent shady IPOs and the existing market trends from proliferating. 

In the events leading to the stock market crash, the stock markets witnessed a massive growth during the first half of 1987. The Dow Jones Industrial Average (DJIA) had by August that year gained a whopping 44 percent in just seven months. The ballooned increase in sales raised concerns of an asset bubble. The numerous news reports about a possible collapse of stock markets undermined investor confidence and further fueled the additional volatility in the markets.

At the time, the federal government announced that there were a larger-than-expected trade deficit and this lead to the plunge of the dollar in value. Earlier in the year, the SEC conducted investigations on illegal insider trading that spooked the investors (Bloch, 1989). High rates of inflation and overheating were experienced at the time due to the high level of credit and economic growth. The Federal Reserve tried to arrest the situation by quickly raising short-term interest rates to decrease inflation, and this dampened the investors’ enthusiasm in the market.

Markets began to show a prediction of the record loses that would be witnessed a week later. On October 14th, some markets started registering significant daily losses in trading.  At the onset of the stock market crash, many institutional trading firms began to utilize portfolio insurance to cushion them against a further plunge in stock (Markham, 2002). The portfolio insurance hedging strategy uses stock index futures to shield equity portfolios from broad stock market declines. In the midst of increased interest rates, many institutional money managers tried to hedge their portfolios to cushion the businesses from the perceived stock market decline.

The stock markets had started plunging in other regions even before the US markets opened for trading that Monday morning. On October 19, the stock market crashed. The crash was caused by the flooding of stock index futures with sell orders worth billions of dollars within a very short time. The influx of the sell orders in the market caused both the futures and the stock market to crash. Additionally, due to the increased volatility of the market, many common stock market investors tried to sell their shares simultaneously and which overwhelmed the stock market.

Stock Market Crash and Global Financial Crisis

On the same day, the 500 billion dollars in market capitalization vanished from the Dow Jones Stock Index within minutes. The emotionally-charged behavior by the common stock investors to sell their shares led to the massive crash of the stock market. Stock markets in different countries plunged in a similar fashion.

The knowledge of a looming stock market crash resulted in investors rushing to their brokers to initiate sales of their assets. Many investors lost billions of investment during the crash. The number of sell orders outnumbered willing buyers by a wider margin creating a cascade in stock markets. Following the 19th October 1987 crash, most futures and stock exchanges were shut down in different countries for a day.

Federal Reserve Stock Market Crash

The Federal Reserve in a move to reduce the extent of the crisis, short-term interest rates were lowered instantly to avert a recession and banking crisis. The markets recovered remarkably from the worst one-day stock market crash. In the aftermath of the stock market plunge, regulators and economists analyzed the events of the Black Monday and identified various causes of the crash.

One of the findings shows that in the preceding years, foreign investors had flooded the US markets, accounting for the meteoric appreciation in stock prices several years before the crisis. The popularization of the portfolio insurance, a new product from the US investment firms was found to be a cause of the meltdown in stock markets. The product accelerated the pace of the crash because its extensive use of options encouraged further rounds of selling after the initial losses.

Soon after the crisis, the economists and regulators identified some flaws that exacerbated the losses experienced in the stock market crash. These flaws were addressed in the following years. First, at the time when the crisis hit the market, stock, options, and futures markets used different timelines for clearing and settlement of trades. The differences in timelines for clearing and settlements of trades created a potential for negative trading account balances and forced liquidations.

At the time of the crisis, the securities exchange had no powers to intervene in the large-scale selling and rapid market declines. Soon after the Black Monday, the trade-clearing protocols were overhauled to bring homogeneity to all important market products. Other rules known as circuit breakers were introduced, enabling exchanges to stop trading temporally in the event of exceptionally large price meltdowns. Under current rules, for instance, the NYSE is mandated to halt trading when the S&P 500 stock exchange plunged by 7%, 13%, and 20% (Markham, 2002). The reasoning behind the formation of this rule is to offer investors a chance to make informed decisions in cases of high market volatility.

The Federal Reserve responded to the crisis by acting as the source of liquidity to support the financial and economic system. The Federal Reserve also encouraged banks to continue lending money to securities firms on their usual terms. The intervention of the Federal Reserve after the Black Monday restored investors’ confidence in the central bank’s ability to restore stability in the event of severe market volatility.

The intervention of the Federal Reserve made securities firms recover from the losses encountered in the Black Monday crisis. The DJIA gained back 57% or 288 points of the total losses incurred in the black Monday crisis in two trading sessions (Bloch, 1989). In a period of less than two years, the US stock markets exceeded their pre-cash highs.

Stock Market Crash – Explain the role played by derivative trading in the 2008 global financial crisis

The world economy faced one of the most severe recessions in 2008 since the great depression of the 1930s (Landuyt, Choudhry, Joannas, Pereira, & Pienaar, 2009). The meltdown began in 2007 when the high home prices in the US began to drop significantly and quickly spreading to the entire US financial sector. The crisis later spread into other financial markets overseas. The financial crisis hit the entire banking industry; two government-chartered companies to provide mortgages, two commercial banks, insurance companies, among others like companies that rely heavily on credit. During the crisis, the share prices dropped significantly throughout the world. The Dow Jones Industrial Average recorded a 33.8% loss of its value in 2008.

Derivatives are defined as financial contracts that obtain their value from an underlying asset. These financial contracts include; stocks, indices, commodities, exchange rates, currencies, or the rate of interest. The financial instruments help in making a profit by banking on the future value of the underlying asset.

Their derivation of value from the underlying asset makes them adopt the name, “Derivatives.” However, the value of the underlying asset changes from time to time. For instance, the exchange rate between two currencies may change, commodity prices may increase or decrease, indices may fluctuate, and stock’s value may rise or fall (Santoro & Strauss, 2012). These variations can work for or against the investor. The investor can make profits or losses according to these changes in the market. The correct guessing of the future price could lead to additional benefits or serve as a safety net from losses in the spot/cash market, where the trading of the underlying assets occurs.

Standard derivatives are usually traded on an exchange. Other types of derivatives are traded over the counter and are unregulated. The use of derivatives can be dangerous when used for investment or speculation without enough supporting capital. Various factors caused the financial crisis of 2008; derivative trading was among them.

Financial innovation can be associated with the 2008 fall in the global financial market. The financial innovation invented derivative securities that claimed to produce safe instruments by diversifying/removing the inherent risks in the underlying assets. The financial innovations, however, did not reduce the inherent risk but increased it (Santoro & Strauss, 2012).

Derivative instruments were created to help manage risks and create insurance against a financial downturn. In the period leading to the 2008 financial crisis, the intentions of the derivatives have been entirely altered. The derivatives were initially invented to defend against risks and protect against the downside. However, in 2003-2007, the derivatives became speculative tools to make more risk in a move to make more profits and returns. During this period, securitized products which were difficult to analyze and price were traded and sold. Additionally, many positions were leveraged with the aim of maximizing the profits gained from trading the derivatives.

Banks created securitized instruments and sold them to investors. The Federal National Mortgage Association rolled out a concerted effort to make home loans more accessible to citizens with lower savings than the required amount by the lenders. The reasoning behind this idea was to help each American citizen acquire the American dream of home ownership.

However, the banks issued poor underlying credit quality which was passed on to the investors. The information that the rating agencies offered the investors about the certification of the quality of the securitized instruments was not sufficient (Allen, 2013). Usually, derivatives ensure against risk if used correctly, in the case of the events leading to the financial crisis of 2008, neither the borrower nor the rating agency understood the risks involved.

In the turn of events in the meltdown, the investors got stuck holding securities that proved to be as risky as holding the underlying loan. The banks were as well stuck because they held many of these instruments as a way of satisfying fixed-income requirements. They used the assets as collateral.

Financial institutions incurred write-downs during the crisis. A write-down refers to the reduction of the book value of an asset because it is overvalued compared to the prevailing market value. In the events leading to the financial plunge in 2008, assets were overvalued, and the financial institutions and investors felt an enormous negative surprise for holding these “safe instruments.”

In the years leading to the financial plunge, banks borrowed funds to lend so as to create more securitized products. Consequently, most of the instruments were created using borrowed capital or margin meaning that the financial institutions did not have to issue a full outlay of capital. The use of leverage (the use of different financial instruments or borrowed capital like margin to increase the potential profit of investment) magnified the crisis.

Credit default swaps also played a part in the crisis. Unlike options and futures, CDSs are traded in over-the-counter (OTC) markets meaning that they are unregulated. In the period before the financial bubble, the advantageous leverage, and convenience of the CDSs made dealers rush to issue and purchase CDSs written only in debt that they did not own.

The derivatives on different underlying assets are traded in unregulated markets. Derivatives such as CDSs are not widely understood since they are not exchange traded (Allen, 2013). Counterpart default risk in OTC markets produces a series of inter-dependencies among market actors and creates room for risk volatility. The result of this is a systemic risk as witnessed in 2008 in the case of Lehman Brothers Holdings Inc. the lack of transparency in the OTC markets played a part in the occurrence of the economic bubble in 2008. The OTC derivatives and risks associated with them were priced incorrectly, and it overwhelmed the financial market during the recession.

References

Allen, S. (2013). Financial risk management. Hoboken, N.J.: Wiley.

Bloch, E. (1989). Inside investment banking. Homewood, Ill.: Dow Jones-Irwin.

Landuyt, G., Choudhry, M., Joannas, D., Pereira, R., & Pienaar, R. (2009). Capital market instruments ;Analysis and valuation. Basingstoke: Palgrave Macmillan.

Markham, J. (2002). A financial history of the United States. Armonk, N.Y.: M.E. Sharpe.

Santoro, M. & Strauss, R. (2012). Wall Street values. Cambridge: Cambridge University Press.

Other Relevant Posts

2008 Financial Crisis

Corporate Decision Making Capital Structure Financial Markets

Finance Dissertation Topics

Did you find any useful knowledge relating to the analysis of the stock market crash and global financial crisis in this post? What are the key facts that grabbed your attention? Let us know in the comments. Thank you.

Coca-Cola Principles of Management

Coca-Cola is a multinational company which has been in the market for a long period of time. For it to survive, the company has adopted proper planning and strategies to its market and customer base. The main theme has been to make Coca-Cola products a refreshing beverage to all people. This theme has been maintained because the company has more than three thousand beverage products that market and customer. t are consumed by its portfolio. In order for this drink to be available to every part of the globe, Coca-Cola has so many companies that help in product distribution (Jones and Comfort, 2018). To have such a range of the beverage products selling well globally require proper strategic plans and marketing strategies. This is because the product has to penetrate through to customers of different cultures, tastes and preferences. Moreover, a strategy which works in one country might not work in another country. For instance, there have been campaign logos like a ‘delightful winter or summer drink’ which have been growing on the media. This advert logo was indicative that Coca-Cola products can be consumed at all times, all year round.

Coca-Cola Strategy, Vision and Mission

The second theme concerns the strategy, vision and mission of this company which are always progressive to make Coca-Cola beverages the first drink of choice by the customers on all occasions any time. The vision, mission and strategy for this company combined at the moment focused on vision 2020. While in 1989 F. David had developed nine components of the mission namely: technology, products, customers, philosophy, location, self-concepts, survival, public image concerns, and employees concerns. Currently, these components have changed and reduced to five, namely: people, portfolio, planet, profits and productivity. Out of these, the company has placed more emphasis on the component of people.

In this case Coca-Cola provides a good working environment through inspiration, and by supporting customers through supporting sustainable community projects. There are links between the former and the current these because some of them have been merged to reduce them from nine to five, while maintaining the final aim. At that time (1989), the mission and vision of the Coca-Cola Company was to sustain the business, improve the public image and meet the concerns of its employees. Once the component of people is properly handled, then customer and employee loyalty increases and hence more sales and profits. Coca-Cola engages in corporate social responsibility, then customer and employee loyalty increases and hence more sales and profits. 

A priority task to provide self-interest as well as care to the people and environment (Smarandescu and Shimp, 2015). Thus, the company has been producing disposable bottles annually. Based on the strategy of making positive contributions to all stakeholders, Coca-Cola USA has partnered with the government to encourage recycling of wastes materials.

Coca-Cola Management Dissertation

Coca-Cola Mission Statement

The major role of the mission statement for a large organization like Coca-Cola is to make the customers, employees and other stakeholders aware about details of what the company is all about as well as the goals of the company (Gertner and Rifkin, 2018). The three mission statements of Coca-Cola are: to refresh the world, inspire moments and happiness, and to create value and make difference. By inspiring moments and happiness, Coca-Cola offers to its customers the beverages of high quality which refreshes their world and creates inspiration via the identity of their brand. The company creates value to stakeholders by participating in sustainability practices which benefits all stakeholders.

An example is the sponsoring of community based activities that have a common good. However, there some contradiction with regards to this mission due to increased solid waste, until the company gets to a point where they can reduce a large portion of the generated wastes. To refresh the world, Coca-Cola has engaged in innovative practices to produce so many beverage brands for its customers globally. From the perspective of Coca-Cola Company, the three points of mission statement have made the company the leading beverage company for so many years.

In the 1980s, most companies were aligned to continued improvement so that a business could survive for a number of years. However, Coca-Cola aligns to the portfolio aspect vaguely, although these companies have been in the process of increasing quality of the products for the consumers through continued improvement.

Reflection

I have come to clearly understand the significance of strategy and planning in a business organization. Without plans that are geared towards the customers, a business is bound to fail. This is because the interest of the customers is the most important.

Considering a company like Pepsi, their vision statement has lid more emphasis on financial performance. However, by concentration on meeting customer expectations and creating a loyal brand, sales and profits follows suit. However, this company also has statements similar to those of Coca-Cola such as corporate social responsibility and sustainability practices.

Coca-Cola has gone a step further to involve its staff in supporting various actions, more so the charity organizations, such as the Wings and Wishes. This is because, in some instances, poor or lack of philanthropic image can damage the long term plans of an organization. This is takes especially when the customers fail to appreciate the efforts of the corporate organizations.

There are a number of advantages and disadvantages associated with teamwork. For instance it increases productivity because a task is distributed based on the teams’ individual abilities. This division of tasks in teams also avoids task duplication and saves time (Costa et al., 2014). It also increases motivation where every team member feels as part of the team. However, teamwork could be associated with some disadvantages too. For example, there might be unnecessary wastage of time, especially when making decisions. This is because each team member has their own opinions and this might take a long time before the final decision is arrived at.

In assignment, since I was not in a group, I found challenges in completing the assignment. While it was easy for me to make decisions on the materials to use for the assignment, I took a long time to compile the important materials and come up with the final output. However, I have learned to make rational decisions and to utilize time properly especially when tasked with a complex issue to solve. Moreover, since I was not in a group I have learned innovative methods when handling complex and challenging tasks so as to come up with a fine output based on the requirements.

References

Jones, P. and Comfort, D., 2018. The Coca-Cola Brand and Sustainability. Indonesian Journal of Applied Business and Economic Research, 1(1).

Smarandescu, L. and Shimp, T.A., 2015. Drink coca-cola, eat popcorn, and choose powerade: testing the limits of subliminal persuasion. Marketing Letters, 26(4), pp.715-726.

Gertner, D. and Rifkin, L., 2018. Coca‐Cola and the Fight against the Global Obesity Epidemic. Thunderbird International Business Review, 60(2), pp.161-173.

Costa, P.L., Passos, A.M. and Bakker, A.B., 2014. Team work engagement: A model of emergence. Journal of Occupational and Organizational Psychology, 87(2), pp.414-436.

Other Related Blog Posts

Can Mass Media Advertising Increase Consumer Perception To Better Brand Credibility? An Investigation into Coca-Cola’s UK Advertising Strategies

Investigation into International Human Resource Performance Management – Case Studies into Coca-Cola and Dow Chemical

The Effects of Marketing Campaigns on Product Sales – A Study of Coca-Cola

Business Management Essay Topics

Did you find any useful knowledge relating to Coca-Cola Principles of Management in this post? What are the key facts that grabbed your attention? Let us know in the comments. Thank you.