2007-2008 Financial Crisis Essay

The 2007-2008 Financial Crisis

2007-2008 Financial Crisis – According to Saylor Academy (2012), a financial crisis happens when many financial markets function inefficiently or stop functioning completely; when one or few of the financial markets stop functioning the crisis that result is nonsystematic Saylor Academy (2012). The 2007 financial crisis started with subprime mortgages and in 2008 it turned severe systematic after major financial institutions failed.

The 2007-2008 Financial Crisis was a combination of many things, including: Monetary policy easing, banks taking excessive risks, consumers borrowing more than they could afford, the eventual US Housing Market Crash, stocks and poor risk pricing, the federal budget deficit, excessive leveraging by banks, predator lending, poor underwriting practices and the Federal Budget Deficit. This paper explores how the 2007-2008 Financial Crisis financial happened, what markets were impacted and how it was dealt with.

Monetary policy easing – Deregulating policies that were placed in placed to repeat historic failures is like playing Jenga, eventually everything will fall. According to (Market Oracle Ltd, 2009), the first block of deregulation happened in 1980 with the Depository Institutions and Monetary Control Act of 1980 – this was the first thing the banking system was being let a bit loose after the regulations that were put into place after the Great Depression.

The act accomplished the following: required less reserved from the banks, it created a committee to get rid of federal interest rate caps, increased insurance of Federal deposits, allowed banks to get credit advances from the Federal Reserve Discount Window and finally, it overstepped over state laws that restricted lenders by putting a ceiling on the interest rates they could charge from mortgage loans.

The second piece of monetary easing happened when the government and their great wisdom or greed decided to pick apart key pieces of the Banking Act of 1933 (Glass-Steagall Act of 1933). The act was in place to prevent banks from gambling with people’s savings, it separated commercial banks from investment banks – this was very important because investment banks could not take huge risks with people’s money.

Gramm-Leach-Bliley Financial Services Modernization Act was the drop that spilled the cup or the final straw that broke the camel’s back. This law, removed the last protective barrier that Glass-Steagall Act provided and allowed banks to do whatever they wanted; for example, Travelers investment bank was able to buy Citibank…Remember the law wanted to keep investment banks from using people savings? Well, this last act allowed investment banks to play with other people’s money (Market Oracle Ltd, 2009). Monetary policy easing removed all roadblocks that annoyed banks, but kept people’s savings intact and save; additionally, it gave birth to Subprime lending which later would be a major player in the Housing Market crash.

Banks taking excessive risks: According to (The Economist, 2013) Senator Phil Gramm once was quoted as saying “I look at subprime lending and I see the American Dream in action”. Due to the economy doing so well and low inflation, banks and investors were willing to take more risks in order to get a piece of the action. Banks were being irresponsible with mortgage lending and lower standards with subprime lending, borrowers who should not have gotten loans were able to get into houses they could not afford.

In order for banks to lessen or mitigate the risks, they played the numbers games, they gathered a many high-risk loan and put them together in groups (pooling), depending on the probability of defaults – in theory, this would decrease the risk because what were the probabilities that all borrowers in that pool could default on their loans? (The Economist, 2013)

Consumers borrowing more than they could afford – This comes back to subprime mortgages and just the timing of what was happening with the economy and the housing market. According to (John V. Duca, 2013) – traditionally, borrowers have to have good credit, good income and good debt to income ration in order to be the proud owners of a house with a white picket fence – those borrowers who did to meet the requirements above, would historically not qualify for any loans to buy a house. The ability of more people qualifying for mortgages they could not afford, lead to an increase in the housing market because the economy was experiencing more first-time home buyers.

The increase in demand created an increase in housing prices and it required more money to be borrowed by the people who were already stretched thin on the amount of money they were borrowing (John V. Duca, 2013). Up to this point, banks and consumers were lending and borrowing money banking on best case scenario and not planning for the worst. Added to the situation was the fact that the government had mandated Fannie Mae and Freddie Mac to increase home ownership, so both Fannie Mae and Freddie Mac had purchased lots of subprime mortgages (John V. Duca, 2013).
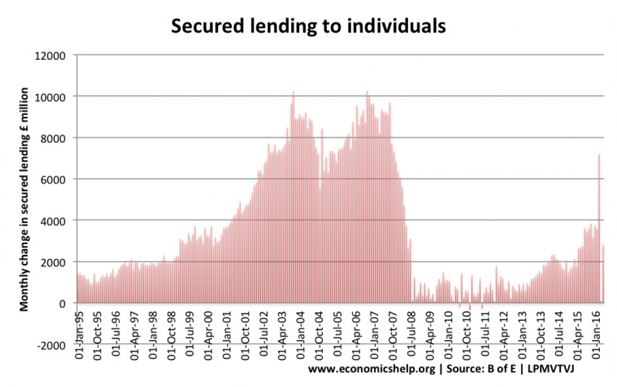
Secured Lending - 2007-2008 Financial Crisis
Secured Lending – 2007-2008 Financial Crisis

US Housing Market Crash – In the famous quote from Isaac Newton “What goes up must come down”.  Once housing market reached its plateau, mortgage financing and home selling became less attractive and that is when they began to drop in price, lenders and investors started losing money. The first casualty of subprime mortgages happened in April 2007, New Century Financial Corps filed for bankruptcy – after that, all the pooling that was done by experts to mitigate default risk was downgraded to high risk and many small subprime lenders went out of business.  Lenders stopped issuing loans, specially the high interest rate ones (subprime) – this resulted in less people getting loans after that and as a result, less houses being purchased by consumers.

Low demand for houses led to a drop-in price, the famous law of supply and demand had kicked in. Prices dropped so much that borrowers who were trying to sell them could not send them at the price they owed in their loans. Remember that government told Fannie Mae and Freddie Mac to increase home ownership? Well, as a result, Fannie Mae and Freddie Mac suffer major losses an all subprime mortgages they had purchased and insured (John V. Duca, 2013). The housing market was flooded by banks selling their foreclosed/repossessed homes, people trying to sell their houses because they get foreclosed, people doing short-sales and in addition the market was getting the normal number of houses being sold the usual sellers (new construction, people moving, etc.).
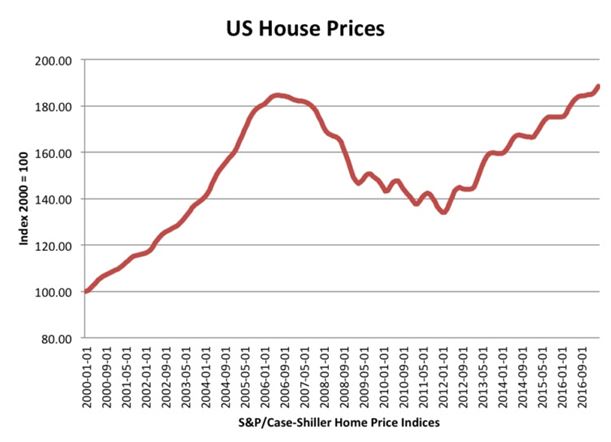
US House Prices - 2007-2008 Financial Crisis
US House Prices – 2007-2008 Financial Crisis

Stocks and poor risk pricing – Prior to the economic crisis, investors were unable to get the exact value of risk they would be bearing when taking up stocks or financial assets from the traders. Risk pricing or the cost of risk is implied in the rate of interest charged and the investors, with poor risk profile of certain assets in the market, would not know the value of the risk assumed when buying stocks or the value of risk exchanged when selling stocks (Amadeo, 2010; Williams, 2010). The market participants were thus inaccurate in their risk analysis due to the complex financial system and innovations among other factors such as ignorance and deceit from the traders themselves.

JP Morgan is quoted as selling and quoting the risk price of CDOs at a price way lower than the market price due to lacking accuracy or information as is contrasted to stable prices in a perfect market, where market information is publicly available, as per the Basel accords. In a similar risk pricing error and crisis, the AIG had to be taken over by the American government, settling about 180 billion US dollars from the tax payers’ money because AIG had taken premium guarantees to pay several CDS obligations to many lenders of small and global parties, whose risk profile was then uncertain to the lender and insurer and plunged the institution into near bankruptcy (Amadeo, 2010).

There was then no clear model of ascertaining the level of risk assumed by a guarantor or a borrower given the dynamic and complex financial innovations of the time and the slowly growing financial academia, practice and experience within a span of two years, that is, between 2007 and 2008 (Jickling, 2009).

The Role of The Federal Reserve in the 2007-2008 Financial Crisis

The Federal Reserve and liquidity – The Federal Reserve is the lender of last result to banks and thus, is the only last savior in a financial crisis. However, the reserve faced inadequate cash to lend to banks with the rapid mortgage and loan processing witnessed alongside booming borrowing and house financing by banks and financial institutions. Commercial banks couldn’t afford adequate liquidity to finance their obligations and the large sizes of mortgages they were buying.

In the same time, the price of commodities and especially minerals such as oil and copper were growing at an unsustainable rate, with most of the minerals being imported from outside. The rise would give the impression to traders that it was an opportunity to invest in the appreciating metals and thus, there was a general cash outflow from the US in exchange for metals and gems, which saw increased trading lead to a decline in the prices thereof and a general loss of cash from the American economy to oil producing and mining countries such as the middle east nations. The cash inflow into the US was less than the cash outflow and commercial  banks would earn less than they were paying as cost of leveraging. This Federal Reserve with less inject into the economy to facilitate liquidity among the commercial banks (Jickling, 2009).

Excessive leveraging by banks – Before the 2007-2008 financial crisis struck the market, banks and other institutions in the mortgage and finance sector had used massive leveraging, that is, using credits and other derivatives to acquire assets. Leveraging shifts the risk of lending to the leveraging institution, thus removes the risk adverseness of a financial institution. They trade with appetite for risky investments which they perceive are most productive. The state of affairs with the highly leveraged financial institutions, therefore, led to risky deals which ultimately led to high rates of defaulting. Also, a major contributor to the 2007-2008 financial crisis.

The high level of leveraging, also, exposed the banks to massive risk impact should a financial downturn result and when it did with the bursting housing prices balloon, the financial institutions came crumbling down, leading to a global and all-sector financial crisis with little identity as to which institutions were in bankruptcy (Amadeo, 2010). This was as a result of a complex system of financial derivatives and contracts that were difficult to determine given the limited financial information then available (Jickling, 2009).

Predator lending – Another factor that contributed greatly and grossly to the financial crisis of the time was the deceitful predatory lending by financial institutions. The institutions would entice borrowers or mortgage buyers with appealing interest rates and have them commit to the mortgages even when such a commitment had hidden charges or adjustments (The Economist, 2010). A common practice involved the use of very low interest rates to hook up people after financing. Upon the completion of the mortgage, the client would realize later that the mortgage was an adjustable one with rates rising gradually to almost double the value they borrowed.

Many would end up unable to pay back the commitments and have their mortgages seized or have to deal with a negative amortization mortgage (McLean & Nocera, 2010).  In one case, the California attorney sued Countrywide Financial for fraudulently enticing borrowers in to a bait-and-switch conman mortgage with expensive mortgage payments (The Economist, 2010). With the falling housing prices, the home owners with outstanding mortgages were demotivated to pay their dues against the devalued prices of their mortgages, leading to massive defaulting and a financial crisis in the industry (Jickling, 2009).

Poor underwriting practices – Another factor that led to the ultimate onset and peaking of the financial crisis was the poor underwriting practices by intermediaries, banks and even insurers. Regulations require that a loaning process should follow the loaning institutions documentation guidelines and the underwriting process ought to be understood in depth to avoid unforeseen difficulties or illegalities. However, the pre-crisis period was characterized by rapid underwriting processes with little or no attention to the lender’s procedures and rules of engagements.

Loans and mortgages would be processed with little or no official documentation completed as per the issuers rules of engagement, which would lead to borrowers being subjected to terms they didn’t sign for or they were unaware of, high defaulting rate by loan holders and selling of loans without full disclosure as to the terms attached to such loans (Greenberg & Hansen, 2009; Amadeo, 2010). At the end, the victims would be realized as unable to honor their commitment due to the inflated loans, some of which would never be recovered.

In this saga, about 1600 mortgages bought by the mortgage firm Citi from mortgage dealers were found to be defective and unenforceable while the mortgages had been passed on from the dealers to the banker. The poor and fraudulent underwriting process therefore contributed immensely to the financial crisis in which banks couldn’t provide financing as they had too many commitments to honor, alongside the housing crisis (Jickling, 2009).

2007-2008 Financial Crisis, in conclusion, this paper asserts the academic and scholarly authority that the largest and longest financial crisis witnessed post the great depression era was as a result of structural factors such as the easing on monetary policies, excess risk assumed by banks, excessive borrowing of cheap but risky loans by consumers, the fall of the US Housing Market, poor risk profile on stocks, the federal budget deficit, over leveraging by banks, predatory lending, poor underwriting and the Federal Budget Deficit. These factors made many banks and institutions to collapse.

References

Amadeo, K. (2010). “2008 Financial Crisis: The Causes and Costs of the Worst Financial Crisis Ever Since the Great Depression.” The Balance.

Greenberg, R., & Hansen, C. (2009). “If you had a pulse, we gave you a loan.” NBC news.

Jickling, M. (2009). Causes of the 2007-2008 Financial Crisis.

McLean, B., & Nocera, J. (2010). All the devils are here: unmasking the men who bankrupted the world. Penguin UK.

The Economist (2010). “Predatory lending: let’s not pretend we don’t understand how it worked.”

Williams, M.T (2010). Uncontrolled risk: the lessons of Lehman Brothers and how systemic risk can still bring down the world financial system. McGraw-Hill.

Relevant Posts

Behavioral Finance Financial Decision Making

Finance Dissertation Topics

Did you find any useful knowledge relating to the 2007-2008 Financial Crisis in this post? What are the key facts that grabbed your attention? Let us know in the comments. Thank you.

Costing Methods Financial Essay

Costing Methods

Costing Methods in Financial Management – The globalization resulted in excessive heights of competition which compelled businesses to the concepts of products and prices. The differentiation strategy works well when the companies charge the lowest prices possible for their products. Business organizations can practice the differentiation in their products by working the quality of their products and implementing some of the marketing approaches like after sale services. With that in mind, the business must conduct market research to ascertain the specific market cost of the products and services then they aligned their products upon the established prices.

Therefore, the standard costing methods remain outdated at this point, and business firms installed more strategic costing procedures. Some of these strategic costs applied by contemporary businesses consist of target costing, life cycle costing, and the Kaizen costing. This report seeks to describe and discuss target costing, life cycle costing, and kaizen costing with their examples and make conclusion and recommendations about the application of three costing methods.

Introduction to Costing Methods

The contemporary customer is a vocal consumer who has the market knowledge thereby posing a stiff competition in the market. The increased competition compels companies to embrace marketing strategies which may make them meet the level of competition trend. As a result, to remain relevant companies must redesign their processes to maximize product quality at reduced costs. Company businesses must work with price reduction as a way to remaining gain the market share in a competitive environment. Therefore, for the realization of the above strategies a company cost detection mark it as the better option.

Therefore, cost methods used by the firm act as significant strategic tools for opportunities identifications that guarantee cost reduction and product quality improvements.  The report describes and discusses target costing, life cycle costing, and kaizen costing as the modern cost management techniques which the company can use to sustain a competitive market environment.

Target Costing

The target costing is a modern cost management technique that has ide coverage usage by most managers. According to Cooper, target costing relates to Functional Cost Analysis as well as Value engineering to align the products and services to match the market dynamics (Cooper 2017). The onset of cost management according to this cost method is at the development stage where the product attributes that match the next generation get incorporated with the intention of generating the required return on investment.

The whole process entails market segmentation to identify the most reliable segment to target and customize the products and services to meet the prevailing conditions. Also, the company must study the convenience of the rival firms in the same segment to deliver the same quality at a cheaper cost. The company proceeds to the next by filtering its activity which is relevant for the delivery of the already established product attributes.

With that in mind, the identified relevant activities are subject to costing to gauge their total costs against the anticipated returns. In the event of any variation, functional costing and value engineering get into play for cost reduction strategies to get employed without compromising the required product quality. The latter process gets continued in line with the market pricing spirit until the best cost is established then the company proceeds to invest in the production of the product required (Talebnia et al. 2017).

Furthermore, functional Cost Analysis together with the Value Engineering techniques help the inter-processes teams to creatively identify the best ways to install the alternative cost reduction product designs without charging the recommendable market features of the product (Talebnia et al. 2017). This is important when analyzing costing methods in the management of finace.

Also, for the company to achieve the maximum value engineering techniques, the company must go through two significant steps by performing some of the radical design changes at the development stage so long as the product is capable of delivering the required service. Second, the use of different design teams may get considered for cost reduction purposes (Talebnia et al. 2017).

According to hart, target costing offers the following advantages to any committed firm (Cooper 2017). First, helps the management with the required knowledge to the development of products and services that are market-oriented through the firm’s strategic objectives, they develop products are following the tastes and preferences of the customer regarding functionality and the delivery method.

Second, it forms an essential element of product development teams, while giving products that are flexible to dynamic costs and life cycle changes and services that are relevant in their application context.

Third, the target costing supports activity-based costing through well-presented costing data during the specific developmental stages. Finally, target costing provides market-driven product features by ascertaining the use of simple, relevant, and user-friendly products. The development teams use simple language to prevent time wastage during costs evaluation (Cooper 2017). 

Life Cycle Costing

The method of life cycle costing considers not only the initial cost of a company asset but also the costs involved over the useful life cycle of the same assets for a rational investment decision (Moreau & Weidema 2015). The life cycle technique confirms the significance of valuing the asset by considering the total ownership costs to provide a viable management decision making. The information about the whole life cycle of an asset can offer some insights such as; future required resources, investment evaluation, and supplier appraisal, resources accountability, improved system design, and asset economic life assessment.

The complexity of the asset in the question determines the kind of life costing approach to get applied, and the annual costing can ask directly approach as opposed to complex computerized processes of future costing. The life cycle costing involved the analysis of the entire asset life span cycle by considering the initial acquisition costs, operating costs, loss of failures, repair cost, preventive costs, and maintenance costs. Other expenses include interest rates, depreciation, present value, and discount rates.

According to Nasik, the life cycle analysis is possible in a spreadsheet with the fair, necessary cost values because it only entails adding up of the respective costs and other rates like discount and interest (Daylan & Ciliz 2016). The costs involved by finding the summation of all the expenses are deterministic, on the other hand, some values are probabilistic like costs concerning the asset reliability and maintainability (Daylan & Ciliz 2016).

The project manager has the responsibility of assessing the present asset condition, the budgeted value for the purchase of the asset, historical background to define the best alternative asset the company may consider worth the investment with the assurance of service delivery beyond the expected levels (Moreau & Weidema 2015).

Therefore, the making it possible for a rational decision concerning capital and expenditures, prioritize every company projects regarding total costs of ownership, and build management confidence when doing their report to major company stakeholders. Life cycle cost analysis also boosts management morale since the analysis assists in project validation calculation, risk reduction strategies, and consistent ways of project evaluation.

The asset life span starts immediately during creation planning to the time of disposal (Daylan & Ciliz 2016). For example, the asset passes through some stages such the concept definition, development of the design features, features specifications and documentation, manufacturing, the awarded warranty duration, and utilization stages. The other steps during the operation include maintenance and finally disposal.

Most importantly, is the strategic and periodic asset life span cycle which always commenced at the strategic planning, the asset formulation, operations level, asset in house maintenance, possible rehabilitation, and finally disposal. The life cycle of the asset is subject to necessary maintainability, technological developments, and the dynamic nature of the operational requirements are the few factors that may influence the life span of an asset (Moreau & Weidema 2015).

Costing Methods Financial Management

Kaizen Costing

The kaizen has its roots from the Japan where the knowledge of continuous improvement originated. According to Hert, the target costing planning process is compatible with the kaizen process in the production stage while firms which concentrate more on the shorter life cycle products usually use the target charging planning instead of combining the two charging methods (Kaplan & Atkinson 2015).

On the other hand, most of the companies with a complex life cycle practice kaizen during their operations at different stages of target costing to get products which are relevant to all generations. Kaizen holds every business organization player to get responsible and embrace never ending the quest for quality improvement through constant job processes evaluation.

All that this method need is just embracing the organization culture whereby all company processes get interconnected in a way that promotes learning from each other on the cost reduction strategies and quality improvement. As a result, kaizen is more aligned with knowledge sharing among the team members with the sole objective of enhancements. The kaizen costing holds the mighty aim of showing the management direction on how to apply the kaizen costing to ascertain a culture of continuous improvement across the organization (Mena et al. 2018). 

In the field of management accounting, kaizen assists firms to gain a competitive edge as it helps the management to do an appraisal to its strategic plans, activities, and long-term operations goals (Mena et al. 2018). With that in mind, the activities such as increasing company improvements, the permanent cost reduction along the production line, and ever diligent in the product design and development stages help the active management to reduce wastes and costs during production. Therefore, the output from the company processes meets the required quality to guarantee customer satisfaction at affordable prices in the market to make the company competitive.

Kaizen differs with the target costing in that the target costing involves product development stages while kaizen comes in during the manufacturing stage to eliminate wastes and reduce costs along the manufacturing lines. Furthermore, the kaizen uses the value analysis method in the form of value engineering to ascertain cost reduction at each process level. Notably, kaizen stresses the improvement in quality and cost delivery through the controlling the product market cost, timely delivery, and distribution.

According to Mark adults, the kaizen profits by getting the difference between corporate management projected profits and lower control expected profits (Kaplan & Atkinson 2015). For a company to achieve the benefits through kaizen costing it must install kaizen costing teams in every department to assist in planning, monitoring, and an evaluation of the processes.

Second, the target charging team must work hand in hand with the kaizen team for compatibility of refined product attributes with the set manufacturing kaizen standards and any variations in kaizen costing must get reported in time to the relevant authority for expert action. Third, the culture of continuous improvement gets supported by active channels of communication across the entire company.

The kaizen principles must get formal communications for kaizen costing information dissemination. Finally, the management ought to establish an evaluation method to gauge the kaizen success on a yearly basis and make the necessary adjustments (Mena et al. 2018).   

Costing Methods Conclusion

The three costing methods are very vital for any business organization to remain competitive in the contemporary market. They help in aligning the products and services offered with the requirement of the dynamic and volatile competitive current markets consisting of a knowledgeable consumer. The knowledge of target costing assist the design and development teams to come up with designs that are generational oriented after thorough market analysis.

The market segmentation helps the team to understand profoundly different needs of a different category of consumers. Also, life cycle costing is an important in management accounting because the methods help the organization concerned with asset acquisition the required knowledge for charging the asset ownership costs, supplier evaluation, and the general company projects evaluation skills.

Moreover, the life cycle helps the procurement and costs expert to acquire the relevant production machines at fair prices. Finally, kaizen costing is an equally more important approach that ascertains reduction of wastes and unnecessary cost along the production lines and, therefore, verifies quality products at affordable market prices. The combined knowledge of the three methods of costing makes a company to gain a competitive advantage in the global markets and assure sustainability.

For the organizations to apply the three costing methods successfully, they need to integrate the accounting knowledge with the strategic management approach thinking for effective internal control systems. Also, the company must work on its both inbound and outbound logistics, production policies and procedures, distribution channels, and marketing strategies like after sales services to offer it a better market advantage over rival firms. Therefore, the successful application of cost management strategies needs an effective and efficient supply chain management.

References

Cooper, R. (2017). Target costing methods and value engineering. Routledge.

Daylan, B., & Ciliz, N. (2016). Life cycle assessment and environmental life cycle costing analysis of lignocellulosic bioethanol as an alternative transportation fuel. Renewable Energy89, 578-587.

Kaplan, R. S., & Atkinson, A. A. (2015). Advanced management accounting and Costing Methods. PHI Learning.

Mena, C., Van Hoek, R., & Christopher, M. (2018). Leading procurement strategy: driving value through the supply chain. Kogan Page Publishers.

Moreau, V., & Weidema, B. P. (2015). The computational structure of environmental life cycle costing. The International Journal of Life Cycle Assessment20(10), 1359-1363.

Talebnia, G., Baghiyan, F., Baghiyan, Z., & Abadi, F. M. N. (2017). Target Costing, the Linkages Between Target Costing and Value Engineering and Expected Profit and Kaizen. International Journal of Engineering1(1), 11-15.

Relevant Posts

Finance Dissertation Topics

Activity Based Costing Project

Did you find any useful knowledge relating to costing methods in financial management in this post? What are the key facts that grabbed your attention? Let us know in the comments. Thank you.

Strategic Finance Management

Strategic finance management refers to the procedures, systems, and practices established by an institution to aid in reaching its goals, such as expansion, stakeholder’s wealth maximization, and corporate social responsibility. The executives develop insights from business activities, its capabilities, stakeholder expectations, as well as the available opportunities. Hence, the strategies have to be based on a well-formulated game-plan, which has a clear vision (Deloitte, 2019).

An appropriate strategic finance management scenario defines an elaborate picture of the organization’s target, lays down the courses of action to lead the entity there, brings work satisfaction and morale, as well as brings together finance officials through fast communication, and timely decision making (Deloitte, 2019).

Ratio Computation and Analysis for Redding and Neaves Companies – Using Strategic Finance Management Techniques

1. Profitability Ratios

This refers to financial computations that investors and business advisers apply while determining an institution’s revenue (Clear Tax, 2018). To get the profit realized, the metrics asses the difference between the receipt and payments made within a particular financial period, such as a year. For the two competing manufacturers, returns on investment and returns on capital employed are used.

a. Return on Investment

It is a ratio used to compute the gains of an investor concerning the amount of their investment. A high ratio, the more the benefits to be earned by the investor (Schmidt, 2019). With this ratio, investors can eliminate the projects promising low profits and focus on those that have a likelihood of raising higher returns.

Return on Investment Redding Co. = Revenue after Tax  × 100

Capital Employed 

ROI = 49 × 100 = 40.49%

121

ROI Neaves Co.

= 379 × 100 = 65.34%

580

Conclusion: Neaves has a higher ROI, hence is earning more revenue compared to Redding by 24.84%. Thus, Neaves is more appealing to an investor.

b. Return on Capital Employed

It is a ratio that is used in determining a company’s profitability due to its efficiency in capital utilization. A company with a higher ROCE means that it had a more economical use of capital that realized maximum gains (Daniel, 2018).            

ROCE = Earnings before Interest and Tax × 100

Capital Employed

Redding: =      80   × 100 = 66.11%.

121      

Neaves ROCE = 503 × 100 = 104.79%

480

Conclusion: both organizations have a significant amount of returns on the capital they have put to use. However, with Neaves having a higher return, investors can prefer it as their investment of choice because it will utilize their funds better.

2. Efficiency Ratios Strategic Finance Management

They are financial metrics that inform on a company’s ability to utilize its assets while keeping an eye on its liabilities in both the short and long terms (Peavler, 2019). It is the efficiency ratios that ensure an organization is not experiencing over investment or under investments. Fixed assets turnover and inventory turnover are the ratios to be used in this analysis.

a. Fixed Assets Turnover

It looks into how a form utilizes the available fixed assets like plants and equipment to increase sales. A firm that has a low number of fixed assets turnover in under utilizing its assets and should work towards optimizing the usage of fixed assets (Peavler, 2019). 

Fixed Assets Turnover = (Sales ÷ Fixed Assets)

Redding Co.

FAT = (195 ÷ 255) = 0.764

Neaves Co.

FAT = (1050 ÷ 1026) = 1.033

Conclusion: Neaves Company has a higher fixed assets turnover, meaning that it utilizes its fixed assets in making sales, better compared to Redding Company.

b. Inventory Turnover

Also known as stock turnover, inventor turnover is a financial metric that is used in determining the number of times that a business has ordered a new batch of inventory after selling a previous batch (Nicasio, 2019). It is computed on pre-determined periods such as semiannually, annually, monthly, or weekly.  

Inventory Turnover = Cost of Sales.

Average Stock 

Redding Co. = 78 = 5.2 Times

15

Neaves Co. = 273 = 8.03 Times  

34

Conclusion: Neaves Co. has a higher inventory turnover ratio than Redding Co. it implies that Neaves has more sales; hence, more promising returns or revenue.

Strategic-Finance-Management

3. Liquidity Ratios

They are ratios used in measuring the ability of an organization to settle its short-term liabilities when they are due without necessarily having to raise capital from lenders (Kenton, and Hayes, 2019). The quick ratio and Current ratio are used in this analysis and commonly found in strategic finance management.

a. Quick Ratio

It is a financial ratio used in determining the ability of an entity to meet its current liabilities using its liquid assets only. In this case, the stock is eliminated from the liquid assets category because it is time-consuming to convert it into cash (Eliodor 2014, P. 5). A company that is at optimal performance should have a quick ratio of 1:1, which shows its ability to pay for the liabilities due using its liquid assets. 

Quick ratio = Current Assets – Stock

   Current Liabilities  

Redding Co. = 65 – 15 = 1.67

  30

Neaves Co. = 198 – 34 = 1.07

153

Conclusion: Since the optimal quick ratio should be 1:1, and both have a quick ratio of more than 1, they can readily service their obligations when due. However, Redding Co has a higher quick ratio and is, therefore, better positioned to convert its liquid assets faster compared to Neaves Co.

c. Current Ratio

It is a liquidity ratio, which is used in measuring an entity’s ability to pay for its short-term liabilities that is the debts due within a year. It informs the investors about how well a company realizes optimal benefits from its current assets so that it can meet its current debts and other payables (Kenton, 2019).  The optimal current ratio should be 2:1 that is two current assets for one current liability

Current Ratio = Current Assets

Current Liabilities

Redding Co.

Current Ratio = 65 = 2.167

30

Neaves Co.

Current Ratio= 198 = 1.294

153

Comparison: Redding Company has a higher current ratio of 2.17:1, while Neave’s Company’s current ratio is 1.29:1. It implies that Redding can quickly pay for its current liabilities while Neaves is going to experience challenges paying for the obligations because it has not met the optimal current ratio.

4. Gearing Ratios.

It is a business assessment ratio that is concerned with the business’s capital structure. The ratio determines the amount and impacts of financing contributed by the stakeholders compared to external funding, such as the use of debt (Bragg, 2019). If a company has a high gearing ratio, it implies that the company has used more of debt capital and less of equity capital. Besides, low gearing means that the company has employed more equity and less of debt in its capital. A highly leveraged/geared company uses debt capital to meet daily obligations, which poses a threat of bankruptcy to the organization (Bragg, 2019). In this comparison, the equity ratio and debt ratio will be used to assess the gearing of the two companies.

a. Equity Ratio/ Net worth to total assets ratio

It is a financial arithmetic that indicates the relative amount of equity that is used in paying for a company’s assets. It informs shareholders about their funds compared to the institution’s total assets, thereby showing the businesses’ solvency position in the future (Ready ratios, 2013).  

Equity ratio = Equity ÷ Total Assets

Redding Co.

Equity ratio = 121 ÷ 320 = 0.378 or 37.8 %.

Neaves Co.

Equity ratio = 480 ÷ 1214 = 0.395 or 39.5 %

Comparison: both companies have an equity ratio of less than 51%. It means that their equity has funded a low amount of their assets, while a significant amount is funded using borrowed funds. The two companies are leveraged and are going to pay a significant amount of interest on the borrowed funds.

b. Debt Ratio

It is a financial leverage arithmetic that is used to measure the amount of a company’s assets that have been purchased using debt capital. If a company has a debt ratio of more than 1, it implies that it has a higher number of liabilities compared to its assets. Conversely, a ratio that is less than 1 indicates that the company has a high proportion of its assets purchased using equity (Investors answers, 2019).

Debt Ratio = Debt

Total Assets

Redding Co.

Debt ratio = 199 = 0.62 or 62%

320

Neaves Co.

Debt ratio = 634 = 0.52 or 52%

1214

Comparison: Redding Co. has a higher debt ratio, meaning that a significant proportion of its assets are acquired using debt capital other than equity. Therefore, Redding Company is more leveraged compared to Neaves Company.

5. Ratios by Investors to Determine Performance

They are financial arithmetic ratios that are used in determining the amount of returns an investor expects if they obtain a company’s stock at the current market prices. The ratio help in determining whether the shares are under priced or overpriced (Peavler, 2019). The ratios to be used are the interest coverage ratio and preference dividend coverage ratio. 

a. Interest Coverage Ratio

It is used in determining the ease of a business in servicing the interest of its borrowed funds from the realized revenue (Ready Ratios, 2013). The higher the ratio, the better the financial stability of an institution. If a company has a ratio of less than 1.0, it is facing challenges in making ales to raise revenue.

Interest Coverage Ratio = Earnings Before Interest and Tax 

Interest Expense

Redding Co.

ICR = 80 ÷ 19 = 4.21

Neaves Co.

ICR = 503 ÷ 29 = 17.34

Comparison: Both companies have an ICR of more than 1. Therefore, they can pay their interest expenses quickly from the revenue realized. Neaves Company is better positioned to pay for interest expenses because it has a higher ICR compared to Redding Co.

b. Preference Dividends Coverage Ratio

It is a financial ratio used in determining the organization’s ability to for its preference dividends.  A company that has issued preference dividends determines its ability to pay the dividends on such shares using this ratio.

Preference dividends coverage ratio = Profits After Tax.

Preference Dividends

Redding Co.

= 49 ÷ 0 = 0

Neaves Co.

379 ÷ 100 = 3.79

Comparison: Redding Company has not issued any preference shares; hence, it doesn’t pay any preference dividends. Neaves Co. has issued preference shares and has a preference dividends coverage ratio of 3.79. The latter company can, therefore, pay for the preference easily when they are due.

References – Strategic Finance Management Essential Reading

Bragg, S. (2019) Gearing ratio, Accounting Tools

Clear tax, (2018) Profitability Ratio Formula with Examples

Daniel, E. (2018) Return on Capital Employed

Deloitte (2019) Finance Strategy solutions

Eliodor, T. (2014)  Financial Statement Analysis, Journal of Knowledge Management, Economics, and IT.

Investing Answers (2019). Debt Ratio

Kenton, W. (2019) Current ratio Analysis – Strategic Finance Management

Kenton, W. (2019)  Strategic Financial Management

Nicasio, F. (2019) Inventory Turnover Definition and How to get it Right

Peavler, R. (2019). Asset Management ratios in Financial Analysis

Ready Radios, (2013) The definition and application of equity ratio – Strategic Finance Management

Schmidt, M. (2019) Returns on Investment Metric for measuring profitability

Strategic Finance Management Relevant Posts

Finance Dissertation Topics

Financial Ratios Financing Constraints

Did you find any useful knowledge relating to Strategic Finance Management in this post? What are the key facts that grabbed your attention? Let us know in the comments. Thank you.

International Financial Management

International Financial Management – Evaluate the extent to which the bargaining model can be viewed as a practical implementation of the law of comparative advantage?

International financial management is a coined term in today’s world, and it is also known as International Finance. In simple words, it means financial management in an International business environment. International Financial Management is, however, different countries and regions due to the different currencies, government situations, political situations, deficient markets, varied opportunity sets (Susan, & Anil 2009, pp. 381–399)

It is said that international financial management came into the limelight when countries started opening up their borders due to the liberation and globalization policies that came with capitalism. Because of the open borders and increased freedom to conduct business in any country around the world. Entrepreneurs started to source for raw materials and establish their business in different countries provided that the state met the preferences of the entrepreneur (Wissam & Ellen 2014).

The development of liberalization was further enhanced by the swift move towards development of telecommunication and transport technologies. Financial innovations such as currency derivatives, multi-currency bonds, cross-border stock listing and International mutual funds further catalyzed the development of international financial management (Frederic et al. 2010, pp. 395-427).

Globalization and Multi-national Firm

Globalization has manifested itself in today’s world through the relationship of financial markets, increasing roles of the multinational corporations, the dependence of the local economies on foreign trade, transfer of technologies. This type of relationship has led to demands for harmonization of the world statically standards (Susan, & Anil 2009, pp. 381–399). Harmonization and standardization include updating the National Accounts System and the Balances of payment among other systems that would make the exchange of capital easier.

Multinational firms have contributed a lot towards international financial management, in fact, MNCs are the focal point for the studies of International Financial Management. Globalization has enabled companies to expand their territories to different countries and regions. For example countries like NIKE, Nescafé, and Shell Oil among others are present in almost the whole world.

According to Frederic et al. (2010, pp. 395-427), the structure of the global industry has experienced great changes especially in the 1990s due to the cross-border mergers and acquisitions; this is evident since most companies committing their affairs freely with stakeholders in different parts of the world is becoming standard. A massive increment by $200 billion to more than $500 billion in cross-border mergers was recorded in a span of only 2years i.e. from 1995 to 1999.

This lead to the healthy of business especially to the advanced developing countries like Taiwan and Hong Kong who are currently leading in investing in China and other South East Asia countries. In South America Brazilian and Chilean firms have dominated the region. In the same sense, Brazil and Argentina based companies have reciprocated. Korean companies overseas are roughly one-third of the massive domestic investments during 1999.

Due to this traffic foreign investment and trade have developed to become inter-wined. There are exports of foreign affiliates in developing states to the parent organizations overseas. This accounts for one-third of all the exports that originate from developing countries while two-thirds of the developing states involve a multinational buyer or seller. In the least developed countries, these ratios are probably higher because of the advantage that Multinational Corporations take over the cheap labor available in these countries. The rise of Multinational companies and foreign ownership has given various opinions about their effects on the developing countries.

International Financial Management and International Monetary Systems

Chiara et al. (2010, pp. 42-65), outlines that the international monetary system involves the management of money flows in conjunction with institutions that are government related that keep track of vast bulk of money including supporting currency needs and it also ensures payment obligations within and across countries are met accordingly. Various institutions that are responsible and are part of the international monetary system include the central banks international financial institutions, commercial banks, and some monetary market funds.

International Financial Management Dissertations

Wissam and Ellen (2014), adds that one distinguishing factor that makes IMS different from other financial institutions is that IMS is not interest bearing. Instead, money is considered as a unit of account and also means of exchanging goods and service and capital flows across borders in order to facilitate and ensure a perfect environment for exchange of financial assets and the excellent of financial markets. The commonly known definition of money since time immemorial is that it’s an asset in addition to its storage of value.

The USD has incurred changes that have been unheard of especially the one noted in 1985 where the dollar had hit a peak of USD 100 Billion a year. According to most economists was far much beyond the equilibrium level that has ever been attained. This record was due to the high exchanging rate which was a sign of confidence in the US economy, the high rate of exchange was due to the sticker hypothesis of the Dornbusch to fiscal irresponsibility. It was then decided that the dollar value be lower without considering much what took it high by intervening in the foreign exchange markets, this was done for the protectionist sentiment that conducted the US Congress that was mounting trading deficit

A plaza agreement that was formed by the big five countries i.e. united states France Japan great Britain and West Germany, a coordinated program to reach the target of forcing down the enormously shooting US dollar value against other currencies, the program worked perfect was successful in the end. It lost 11 percent of its SDR in 1986, the decrement of the US dollar was steady when Italy and Canada joined the group 5, forming a new group known as the G-7.

The policies worked like a charm, and the US promised to cut the budget deficit and ultimately lower the rate at which the dollar was growing. To achieve this further Japan and Canada promised to stimulate their economies, although they achieved the reduction of the dollar value the budget cuts weren’t forthcoming and so Germany and Japan never succeeded in their mission to stimulate their economies (Arthur 2003, pp. 979-992).

Trade is among the factors in addition to inequities that balances out countries in todays world. These fluctuations in a system of a freely floating exchange of goods and services gives the adjustment system to bring trade back to balances. A country that has both trade and account deficit could get back to balance through devaluing its currency which will increase its exports and lessen the amount of imports (Chiara et al. 2010, pp. 42-65).

In reality the existence of chronic trade deficits in country have consequences to the economy through the systems of flexible exchange rate. One of the main reason for the failure in adjustment of exchange rates is deficit for incentives for various states to keep their currency strong in order to attract foreign investments. But according to the reports by the World Bank over valued currencies only impairs trade more while calling for more inflow of foreign currencies. Finally the game reaches the end and the investors run away and the deficit country have a fall in their currency that erodes even the domestic savings and ushers in inflation and these leads to the international financial management emergency assistance that is directed towards economic austerity.

World Bank statistics recognizes the fact that a mechanism of semi-fixed exchange rates that provides for flexibility in a narrow range and orderly mechanism for adjustments for such ranges. In 1994 the former chairman of the Bretton Woods Commission Volcker Paul openly condemned the liberation of the exchange rates and advocated for the semi-fixed exchange rate regime (Jean et al. 2005, pp. 1-43). In exchange for the Bretton Woods Institution (World Bank and IMF) the countries suffering from deficits are expected to implement a range of deflationary fiscal and deflationary policies, in the late 1990s they were known as Structural Adjustment Program and mostly implemented through letters of intent. The process is usually refer to us loan conditionality’s since IMF financial assistance are conditioned when implementing policy reforms (Xiaoying & Xiaming 2005, pp. 393-407).

Foreign Direct Investments

The rise of foreign Direct Investment started over tree decades ago. From 1980s when the FDI flow was estimated to be 50 billion US Dollars per year OFD has grown up to 2.1 trillion US Dollars in 2007. Due to the economic recession in 2008 FDI fell down to 1.9 trillion US Dollars that is -10% (James & Mark 2000). Foreign direct Investments from developed countries have increased due to the high growth in economies and high performance from the corporate world of these countries.

OFDI particularly flows from the European Union and The United States of America who take up to 84%, the remaining 16% is represented by the transitional economies (BRIC countries).

International financial management, the distribution of emerging market OFDI has evolved considerably changed over the past years. Asia overtook Latin America and Caribbean America has become leading region for Foreign Direct Investment. While MNCs have become fundamental investors in many developing countries, they have also invested in developed countries. The general number of Multinational Corporations has been growing in tandem, with FDI (Caroline 2004, pp. 20-29). This rise does not only show the increasing ownership benefits of these firms but also the pressure for the companies to get a portfolio locality assets as foundation for International competitiveness (Arthur 2003, pp. 979-992).

The Bargaining Model

According to the theory of bargaining, governments yearn for development and a stability payment balance. These goals can be achieved through attracting foreign investments. On the other hand, MNCs are in constant look for sources of raw materials and strategic manufacturing points near their targeted markets. These objectives can be satisfied when MNCs deal successfully with governments of host countries because it is through the sovereignty of the states that the MNCs can achieve these Governments seek economic development and balance-of-payments stability, for example, and both goals can be pursued by attracting and channeling the activities of foreign TNCs. TNCs seek inexpensive sources of raw materials and manufacturing sites (Chiara et al. 2010, pp. 42-65). According to Jean et al. (2005, pp. 1-43).The bargaining process is enhanced by the relative resources that each country has.

The government has its high points from the control over the two most fundamental requirement of the MNCs which are raw materials and intensive labor. On the other hand, the MNCs have goodies that the government desires that they use to influence the government with some of these goodies include helping in lowering the unemployment rate in the country, improving the host countries balance of payments through providing access to the International Markets (Arthur 2003, pp. 979-992).

The relevance of these factors during the bargaining process substantially determines the expected outcome of negotiation between an MNC and the national government. Another factor that greatly influences the negotiation process is the situation between the firm and the government. The relative stakes that each party offers give a situation affecting the bargaining outcome.

Lastly the degree of similarity of interests that both the government and the multinational corporation have. The Similarity of interests makes negotiation more natural and smooth while different and parallel interests among the principles will make decision making very hard (Arthur 2003, pp. 979-992).

The Balance of Payments in International Financial Management

According to Wissam and Ellen (2014) defines this as an account records the payments and receipts of transactions of the citizens of that particular country with residents living in another country. Ones the payments and receipts of each country will include equally only if the operations are also included, neutrality will only favor one state at the expense of the other by allowing it acquire more assets from the not so preferred country. (Xiaoying & Xiaming 2005, pp. 393-407).

An evident example is if Americans purchase automobiles from the Japanese, and don’t engage further in other transactions chances are the Japan will end up holding dollars either in the form of bank deposits or engage in other investments in the US. These payments are then balanced depending on the transactions made for the acquisition of the dollar assets (Jean et al. 2005, pp. 1-43).

However much the balancing is done deficits must occur as a result of inequalities and excess payments, therefore leading to a surplus in particular forms of transactions including the service trade merchandise trade (James & Mark 2000). The balance of payments in any country must refer to some class of operations.

Various definitions have been given to the balance of payments surplus and deficits in the past. Every definition had its distinct implications and purposes. It is until 1973 that there was a focus on the definition of balance-of-payments which had the intentions of measuring the ability of a country to meets its responsibilities of exchanging its currency for other currencies or for tagging it to the Gold system at a fixed rate exchange like the Great Britain did (Maurice 2010, pp. 1–23).

So as to meet the newly formed obligations countries strived to maintain a stock of official reserves, in the form of foreign country currencies or gold that they would use to in supporting their local currencies. The decline in this stores stock was seen as crucial balance-of-payment deficit since it threatened a country’s ability to meet its responsibilities (Arthur 2003, pp. 979-992).

This type of debt was not a good indicator at all when looking at the financial position of a state. The reason being that it never looked at the likelihood that the state would be called upon to meet its delegated duties and the willingness of the international monetary institution to provide assistance (James & Mark 2000).

Caroline (2004, pp. 20-29), points that after 1973, official reserves unit of measuring a country’s ability to meet its obligations diminished as various economic giants gave up their responsibility of converting their currency at a fixed exchange. The made reserves look more meaningless, and there was no longer any concern about the changes in a country’s reserves (Ngaire 2000, pp. 82-841).

Xiaoying and Xiaming (2005, pp. 393-407), purports that after the 1973 talks on the balance of payment surplus or deficits now refer to current accounts. This account has a trade in goods, investment incomes earned abroad and the unilateral transfers. It doesn’t include the capital account, which includes the sales of securities or property. Since the current account and the capital account sum up to the total account, which is necessarily balanced, debt in the current account always comes with an equal surplus in the capital account and vice versa (Maurice 2010, pp. 1–23). Deficit or surplus present in the current account cannot be evaluated without different explanations and the evaluation of an equal surplus or deficit in the capital account.

A State is considered to be in deficit when in its current account is higher its price level. When the Gross National Product is greater the interests rates are also higher and the lesser the barriers towards imports and more attractive it’s to international investors, compared to other countries (Barry 1999).

Kenneth (1996, pp. 647-668), argues that the impacts of any change in one of these factors on the country’s current account balance cannot be predicted without looking at the effects of the other international financial management factors. For instance, if the government increases tariffs, citizens are likely to import fewer goods, therefore, decreasing the current account deficit. In this case, where this decline will occur only when one of other factors changes to bring about a reduction in the capital account surplus.

According to Axel and James (2015, pp.120-148), if none of these factors changes then the decrease in imports due to an increase in tariffs will lead to a decline in the demand for the country’s foreign currency, this, in turn, will raise the local value of the respective country. The increase in the value of any countries increase makes that individual country exports more expensive and imports cheaper, therefore offsetting the implications of the growth in Tariffs. The overall result is that the increase in tariff will bring no change to the current account (Caroline 2004, pp. 20-29)

Contrary to the thoughts of most people, the existence of a deficit in the present account in itself is not a signal towards a recessing economy or irrational economic policies. If a country has a deficit in its current account, it can sometimes mean that the country is importing capital. Importing capital is no more a peculiar system it is just like importing coffee or tea.

References

 Arthur, C 2003. “The euro: faith, hope and parity, International Affairs.” pp. 979-992.

 Axel, D 2009. “IMF conditionality: theory and evidence, Public Choice.” pp. 233-267.

 Axel, D, Jan, E, S & James Vreeland 2015. “Politics and IMF Conditionality”. Journal of Conflict Resolution. Vol. 59, Vol. 1, pp.120-148.

 Barry, E 1999. “Kicking the Habit: moving from pegged exchange rates to greater exchange rate flexibility”. The Economic Journal C1 – C14 Equator Principles III.

 Caroline, M 2004. “Managing Exchange Rates: Achievement of Global Rebalancing or evidence of global co-dependency.” Business Economics, pp. 20-29.

 Chiara, F, Francesco, R & Giuseppe, M 2010. “Why do Firms Invest Abroad? An Analysis of the Motives Underlying Foreign Direct Investments.” The IUP Journal of International Business Law. Vol. 9, No. 1 & 2, pp. 42-65

 Frederic, B, Melika, B, S & Marine C 2010. “Detecting Mean Reversion in Real Exchange Rates from a Multiple Regime STAR model.” Annals of Economics and Statistics, pp. 395-427.

 James, R, L & Mark, P, T 2000. “Purchasing power parity over two centuries: strengthening the case for real exchange rate stability A reply to Cuddington and Liang.” Journal of International Money and Finance. Vol. 19, No.1, pp. 759–764.

 Jean, I, Haroon, M, Morten R & Helene Rey 2005. “PPP Strikes Back: Aggregation and the Real Exchange Rate.” The Quarterly Journal of Economics. Vol.34, No 1, pp. 1-43.

 John, H, D 2000. “The eclectic paradigm as an envelope for economic and business theories of MNE activity”. International Business Review 9, pp. 163–190.

 Kenneth, R 1996. “International Financial Management The Purchasing Power Parity Puzzle.” Journal of Economic Literature. Vol. 45, pp. 647-668.

 Maurice, O 2010. “Does the Current Account Still Matter?” American Economic Review. Vol.102, No. 3, pp. 1–23.

Ngaire, W 2000. “The Challenge of Good Governance for the IMF and the World Bank Themselves.” World Development. Vol. 28, No. 5, pp. 82-841.

Shaun, F & Andrew L 2004. “International Financial Management, new financial system? Towards a conceptualization of financial reintermediation.” Review of International Political Economy. Vol. 11, No.2, pp. 263-288.

 Susan, F & Anil G 2009. “Subsidiaries and Country Risk: internalization as a safeguard against weak external institutions.” Academy of International Financial Management, Vol. 52, No. 2, pp. 381–399.

 Wissam, H & Ellen, M 2014. “Hong Kong’s Currency Crisis: A Test of the 1990s.” Washington Consensus’ View, International Finance. Vol. 17, No.3, pp. 273–296.

Xiaoying, L & Xiaming, L .2005. “Foreign Direct Investment, International Financial Management and Economic Growth.” An Increasingly Endogenous Relationship World Development. Vol. 33, No. 3, pp. 393-407.

Where Can I Find Finance Dissertations?

Finance Dissertation Topics

Did you find any useful knowledge relating to international financial management in this post? What are the key facts that grabbed your attention? Let us know in the comments. Thank you.
Stock Market Crash Global Financial Crisis

Analysis of the Stock Market Crash and Global Financial Crisis

The stock market crash in the autumn of 1987 is labeled as one of the sharpest markets down in history. Stock markets around the world plummeted in a matter of hours. The Black Monday, as it is labeled, is market as one of the major contemporary global financial crisis after the great depression that hit the global market between 1929 and 1941 (Markham, 2002). In the US, the stock market crash was marked by the 22.6 percent drop in a single trading session of the Dow Jones Industrial Average (DJIA).

In the years leading up to the stock market crash on October 19, 1987, there was an extension of a continuation of a highly powerful bull market. At this period, running from 1982, the market had started to embrace globalization and the advancement in technology. In the years 1986 and 1987, the bull market was fueled by hostile takeovers, low-interest rates, leveraged buyouts and increased mergers (Bloch, 1989).

The business philosophy at the time encouraged exponential business growth by acquisition of others. At the time, companies used leveraged buyouts to raise massive amounts of capital to fund the procurement of the desired companies. The companies raised the capital by selling junk bonds to the public. The junk bonds refer to the bonds that pay high-interest rates by the virtue of their high risk of default. Initial public offering or IPO was another trend used to drive market excitement.

During that time of increased market activity, the US Securities, and Exchange Commission (SEC) found it extremely hard to prevent shady IPOs and the existing market trends from proliferating. 

In the events leading to the stock market crash, the stock markets witnessed a massive growth during the first half of 1987. The Dow Jones Industrial Average (DJIA) had by August that year gained a whopping 44 percent in just seven months. The ballooned increase in sales raised concerns of an asset bubble. The numerous news reports about a possible collapse of stock markets undermined investor confidence and further fueled the additional volatility in the markets.

At the time, the federal government announced that there were a larger-than-expected trade deficit and this lead to the plunge of the dollar in value. Earlier in the year, the SEC conducted investigations on illegal insider trading that spooked the investors (Bloch, 1989). High rates of inflation and overheating were experienced at the time due to the high level of credit and economic growth. The Federal Reserve tried to arrest the situation by quickly raising short-term interest rates to decrease inflation, and this dampened the investors’ enthusiasm in the market.

Markets began to show a prediction of the record loses that would be witnessed a week later. On October 14th, some markets started registering significant daily losses in trading.  At the onset of the stock market crash, many institutional trading firms began to utilize portfolio insurance to cushion them against a further plunge in stock (Markham, 2002). The portfolio insurance hedging strategy uses stock index futures to shield equity portfolios from broad stock market declines. In the midst of increased interest rates, many institutional money managers tried to hedge their portfolios to cushion the businesses from the perceived stock market decline.

The stock markets had started plunging in other regions even before the US markets opened for trading that Monday morning. On October 19, the stock market crashed. The crash was caused by the flooding of stock index futures with sell orders worth billions of dollars within a very short time. The influx of the sell orders in the market caused both the futures and the stock market to crash. Additionally, due to the increased volatility of the market, many common stock market investors tried to sell their shares simultaneously and which overwhelmed the stock market.

Stock Market Crash and Global Financial Crisis

On the same day, the 500 billion dollars in market capitalization vanished from the Dow Jones Stock Index within minutes. The emotionally-charged behavior by the common stock investors to sell their shares led to the massive crash of the stock market. Stock markets in different countries plunged in a similar fashion.

The knowledge of a looming stock market crash resulted in investors rushing to their brokers to initiate sales of their assets. Many investors lost billions of investment during the crash. The number of sell orders outnumbered willing buyers by a wider margin creating a cascade in stock markets. Following the 19th October 1987 crash, most futures and stock exchanges were shut down in different countries for a day.

Federal Reserve Stock Market Crash

The Federal Reserve in a move to reduce the extent of the crisis, short-term interest rates were lowered instantly to avert a recession and banking crisis. The markets recovered remarkably from the worst one-day stock market crash. In the aftermath of the stock market plunge, regulators and economists analyzed the events of the Black Monday and identified various causes of the crash.

One of the findings shows that in the preceding years, foreign investors had flooded the US markets, accounting for the meteoric appreciation in stock prices several years before the crisis. The popularization of the portfolio insurance, a new product from the US investment firms was found to be a cause of the meltdown in stock markets. The product accelerated the pace of the crash because its extensive use of options encouraged further rounds of selling after the initial losses.

Soon after the crisis, the economists and regulators identified some flaws that exacerbated the losses experienced in the stock market crash. These flaws were addressed in the following years. First, at the time when the crisis hit the market, stock, options, and futures markets used different timelines for clearing and settlement of trades. The differences in timelines for clearing and settlements of trades created a potential for negative trading account balances and forced liquidations.

At the time of the crisis, the securities exchange had no powers to intervene in the large-scale selling and rapid market declines. Soon after the Black Monday, the trade-clearing protocols were overhauled to bring homogeneity to all important market products. Other rules known as circuit breakers were introduced, enabling exchanges to stop trading temporally in the event of exceptionally large price meltdowns. Under current rules, for instance, the NYSE is mandated to halt trading when the S&P 500 stock exchange plunged by 7%, 13%, and 20% (Markham, 2002). The reasoning behind the formation of this rule is to offer investors a chance to make informed decisions in cases of high market volatility.

The Federal Reserve responded to the crisis by acting as the source of liquidity to support the financial and economic system. The Federal Reserve also encouraged banks to continue lending money to securities firms on their usual terms. The intervention of the Federal Reserve after the Black Monday restored investors’ confidence in the central bank’s ability to restore stability in the event of severe market volatility.

The intervention of the Federal Reserve made securities firms recover from the losses encountered in the Black Monday crisis. The DJIA gained back 57% or 288 points of the total losses incurred in the black Monday crisis in two trading sessions (Bloch, 1989). In a period of less than two years, the US stock markets exceeded their pre-cash highs.

Stock Market Crash – Explain the role played by derivative trading in the 2008 global financial crisis

The world economy faced one of the most severe recessions in 2008 since the great depression of the 1930s (Landuyt, Choudhry, Joannas, Pereira, & Pienaar, 2009). The meltdown began in 2007 when the high home prices in the US began to drop significantly and quickly spreading to the entire US financial sector. The crisis later spread into other financial markets overseas. The financial crisis hit the entire banking industry; two government-chartered companies to provide mortgages, two commercial banks, insurance companies, among others like companies that rely heavily on credit. During the crisis, the share prices dropped significantly throughout the world. The Dow Jones Industrial Average recorded a 33.8% loss of its value in 2008.

Derivatives are defined as financial contracts that obtain their value from an underlying asset. These financial contracts include; stocks, indices, commodities, exchange rates, currencies, or the rate of interest. The financial instruments help in making a profit by banking on the future value of the underlying asset.

Their derivation of value from the underlying asset makes them adopt the name, “Derivatives.” However, the value of the underlying asset changes from time to time. For instance, the exchange rate between two currencies may change, commodity prices may increase or decrease, indices may fluctuate, and stock’s value may rise or fall (Santoro & Strauss, 2012). These variations can work for or against the investor. The investor can make profits or losses according to these changes in the market. The correct guessing of the future price could lead to additional benefits or serve as a safety net from losses in the spot/cash market, where the trading of the underlying assets occurs.

Standard derivatives are usually traded on an exchange. Other types of derivatives are traded over the counter and are unregulated. The use of derivatives can be dangerous when used for investment or speculation without enough supporting capital. Various factors caused the financial crisis of 2008; derivative trading was among them.

Financial innovation can be associated with the 2008 fall in the global financial market. The financial innovation invented derivative securities that claimed to produce safe instruments by diversifying/removing the inherent risks in the underlying assets. The financial innovations, however, did not reduce the inherent risk but increased it (Santoro & Strauss, 2012).

Derivative instruments were created to help manage risks and create insurance against a financial downturn. In the period leading to the 2008 financial crisis, the intentions of the derivatives have been entirely altered. The derivatives were initially invented to defend against risks and protect against the downside. However, in 2003-2007, the derivatives became speculative tools to make more risk in a move to make more profits and returns. During this period, securitized products which were difficult to analyze and price were traded and sold. Additionally, many positions were leveraged with the aim of maximizing the profits gained from trading the derivatives.

Banks created securitized instruments and sold them to investors. The Federal National Mortgage Association rolled out a concerted effort to make home loans more accessible to citizens with lower savings than the required amount by the lenders. The reasoning behind this idea was to help each American citizen acquire the American dream of home ownership.

However, the banks issued poor underlying credit quality which was passed on to the investors. The information that the rating agencies offered the investors about the certification of the quality of the securitized instruments was not sufficient (Allen, 2013). Usually, derivatives ensure against risk if used correctly, in the case of the events leading to the financial crisis of 2008, neither the borrower nor the rating agency understood the risks involved.

In the turn of events in the meltdown, the investors got stuck holding securities that proved to be as risky as holding the underlying loan. The banks were as well stuck because they held many of these instruments as a way of satisfying fixed-income requirements. They used the assets as collateral.

Financial institutions incurred write-downs during the crisis. A write-down refers to the reduction of the book value of an asset because it is overvalued compared to the prevailing market value. In the events leading to the financial plunge in 2008, assets were overvalued, and the financial institutions and investors felt an enormous negative surprise for holding these “safe instruments.”

In the years leading to the financial plunge, banks borrowed funds to lend so as to create more securitized products. Consequently, most of the instruments were created using borrowed capital or margin meaning that the financial institutions did not have to issue a full outlay of capital. The use of leverage (the use of different financial instruments or borrowed capital like margin to increase the potential profit of investment) magnified the crisis.

Credit default swaps also played a part in the crisis. Unlike options and futures, CDSs are traded in over-the-counter (OTC) markets meaning that they are unregulated. In the period before the financial bubble, the advantageous leverage, and convenience of the CDSs made dealers rush to issue and purchase CDSs written only in debt that they did not own.

The derivatives on different underlying assets are traded in unregulated markets. Derivatives such as CDSs are not widely understood since they are not exchange traded (Allen, 2013). Counterpart default risk in OTC markets produces a series of inter-dependencies among market actors and creates room for risk volatility. The result of this is a systemic risk as witnessed in 2008 in the case of Lehman Brothers Holdings Inc. the lack of transparency in the OTC markets played a part in the occurrence of the economic bubble in 2008. The OTC derivatives and risks associated with them were priced incorrectly, and it overwhelmed the financial market during the recession.

References

Allen, S. (2013). Financial risk management. Hoboken, N.J.: Wiley.

Bloch, E. (1989). Inside investment banking. Homewood, Ill.: Dow Jones-Irwin.

Landuyt, G., Choudhry, M., Joannas, D., Pereira, R., & Pienaar, R. (2009). Capital market instruments ;Analysis and valuation. Basingstoke: Palgrave Macmillan.

Markham, J. (2002). A financial history of the United States. Armonk, N.Y.: M.E. Sharpe.

Santoro, M. & Strauss, R. (2012). Wall Street values. Cambridge: Cambridge University Press.

Other Relevant Posts

2008 Financial Crisis

Corporate Decision Making Capital Structure Financial Markets

Finance Dissertation Topics

Did you find any useful knowledge relating to the analysis of the stock market crash and global financial crisis in this post? What are the key facts that grabbed your attention? Let us know in the comments. Thank you.