Stock Market Crash Global Financial Crisis

Analysis of the Stock Market Crash and Global Financial Crisis

The stock market crash in the autumn of 1987 is labeled as one of the sharpest markets down in history. Stock markets around the world plummeted in a matter of hours. The Black Monday, as it is labeled, is market as one of the major contemporary global financial crisis after the great depression that hit the global market between 1929 and 1941 (Markham, 2002). In the US, the stock market crash was marked by the 22.6 percent drop in a single trading session of the Dow Jones Industrial Average (DJIA).

In the years leading up to the stock market crash on October 19, 1987, there was an extension of a continuation of a highly powerful bull market. At this period, running from 1982, the market had started to embrace globalization and the advancement in technology. In the years 1986 and 1987, the bull market was fueled by hostile takeovers, low-interest rates, leveraged buyouts and increased mergers (Bloch, 1989).

The business philosophy at the time encouraged exponential business growth by acquisition of others. At the time, companies used leveraged buyouts to raise massive amounts of capital to fund the procurement of the desired companies. The companies raised the capital by selling junk bonds to the public. The junk bonds refer to the bonds that pay high-interest rates by the virtue of their high risk of default. Initial public offering or IPO was another trend used to drive market excitement.

During that time of increased market activity, the US Securities, and Exchange Commission (SEC) found it extremely hard to prevent shady IPOs and the existing market trends from proliferating. 

In the events leading to the stock market crash, the stock markets witnessed a massive growth during the first half of 1987. The Dow Jones Industrial Average (DJIA) had by August that year gained a whopping 44 percent in just seven months. The ballooned increase in sales raised concerns of an asset bubble. The numerous news reports about a possible collapse of stock markets undermined investor confidence and further fueled the additional volatility in the markets.

At the time, the federal government announced that there were a larger-than-expected trade deficit and this lead to the plunge of the dollar in value. Earlier in the year, the SEC conducted investigations on illegal insider trading that spooked the investors (Bloch, 1989). High rates of inflation and overheating were experienced at the time due to the high level of credit and economic growth. The Federal Reserve tried to arrest the situation by quickly raising short-term interest rates to decrease inflation, and this dampened the investors’ enthusiasm in the market.

Markets began to show a prediction of the record loses that would be witnessed a week later. On October 14th, some markets started registering significant daily losses in trading.  At the onset of the stock market crash, many institutional trading firms began to utilize portfolio insurance to cushion them against a further plunge in stock (Markham, 2002). The portfolio insurance hedging strategy uses stock index futures to shield equity portfolios from broad stock market declines. In the midst of increased interest rates, many institutional money managers tried to hedge their portfolios to cushion the businesses from the perceived stock market decline.

The stock markets had started plunging in other regions even before the US markets opened for trading that Monday morning. On October 19, the stock market crashed. The crash was caused by the flooding of stock index futures with sell orders worth billions of dollars within a very short time. The influx of the sell orders in the market caused both the futures and the stock market to crash. Additionally, due to the increased volatility of the market, many common stock market investors tried to sell their shares simultaneously and which overwhelmed the stock market.

Stock Market Crash and Global Financial Crisis

On the same day, the 500 billion dollars in market capitalization vanished from the Dow Jones Stock Index within minutes. The emotionally-charged behavior by the common stock investors to sell their shares led to the massive crash of the stock market. Stock markets in different countries plunged in a similar fashion.

The knowledge of a looming stock market crash resulted in investors rushing to their brokers to initiate sales of their assets. Many investors lost billions of investment during the crash. The number of sell orders outnumbered willing buyers by a wider margin creating a cascade in stock markets. Following the 19th October 1987 crash, most futures and stock exchanges were shut down in different countries for a day.

Federal Reserve Stock Market Crash

The Federal Reserve in a move to reduce the extent of the crisis, short-term interest rates were lowered instantly to avert a recession and banking crisis. The markets recovered remarkably from the worst one-day stock market crash. In the aftermath of the stock market plunge, regulators and economists analyzed the events of the Black Monday and identified various causes of the crash.

One of the findings shows that in the preceding years, foreign investors had flooded the US markets, accounting for the meteoric appreciation in stock prices several years before the crisis. The popularization of the portfolio insurance, a new product from the US investment firms was found to be a cause of the meltdown in stock markets. The product accelerated the pace of the crash because its extensive use of options encouraged further rounds of selling after the initial losses.

Soon after the crisis, the economists and regulators identified some flaws that exacerbated the losses experienced in the stock market crash. These flaws were addressed in the following years. First, at the time when the crisis hit the market, stock, options, and futures markets used different timelines for clearing and settlement of trades. The differences in timelines for clearing and settlements of trades created a potential for negative trading account balances and forced liquidations.

At the time of the crisis, the securities exchange had no powers to intervene in the large-scale selling and rapid market declines. Soon after the Black Monday, the trade-clearing protocols were overhauled to bring homogeneity to all important market products. Other rules known as circuit breakers were introduced, enabling exchanges to stop trading temporally in the event of exceptionally large price meltdowns. Under current rules, for instance, the NYSE is mandated to halt trading when the S&P 500 stock exchange plunged by 7%, 13%, and 20% (Markham, 2002). The reasoning behind the formation of this rule is to offer investors a chance to make informed decisions in cases of high market volatility.

The Federal Reserve responded to the crisis by acting as the source of liquidity to support the financial and economic system. The Federal Reserve also encouraged banks to continue lending money to securities firms on their usual terms. The intervention of the Federal Reserve after the Black Monday restored investors’ confidence in the central bank’s ability to restore stability in the event of severe market volatility.

The intervention of the Federal Reserve made securities firms recover from the losses encountered in the Black Monday crisis. The DJIA gained back 57% or 288 points of the total losses incurred in the black Monday crisis in two trading sessions (Bloch, 1989). In a period of less than two years, the US stock markets exceeded their pre-cash highs.

Stock Market Crash – Explain the role played by derivative trading in the 2008 global financial crisis

The world economy faced one of the most severe recessions in 2008 since the great depression of the 1930s (Landuyt, Choudhry, Joannas, Pereira, & Pienaar, 2009). The meltdown began in 2007 when the high home prices in the US began to drop significantly and quickly spreading to the entire US financial sector. The crisis later spread into other financial markets overseas. The financial crisis hit the entire banking industry; two government-chartered companies to provide mortgages, two commercial banks, insurance companies, among others like companies that rely heavily on credit. During the crisis, the share prices dropped significantly throughout the world. The Dow Jones Industrial Average recorded a 33.8% loss of its value in 2008.

Derivatives are defined as financial contracts that obtain their value from an underlying asset. These financial contracts include; stocks, indices, commodities, exchange rates, currencies, or the rate of interest. The financial instruments help in making a profit by banking on the future value of the underlying asset.

Their derivation of value from the underlying asset makes them adopt the name, “Derivatives.” However, the value of the underlying asset changes from time to time. For instance, the exchange rate between two currencies may change, commodity prices may increase or decrease, indices may fluctuate, and stock’s value may rise or fall (Santoro & Strauss, 2012). These variations can work for or against the investor. The investor can make profits or losses according to these changes in the market. The correct guessing of the future price could lead to additional benefits or serve as a safety net from losses in the spot/cash market, where the trading of the underlying assets occurs.

Standard derivatives are usually traded on an exchange. Other types of derivatives are traded over the counter and are unregulated. The use of derivatives can be dangerous when used for investment or speculation without enough supporting capital. Various factors caused the financial crisis of 2008; derivative trading was among them.

Financial innovation can be associated with the 2008 fall in the global financial market. The financial innovation invented derivative securities that claimed to produce safe instruments by diversifying/removing the inherent risks in the underlying assets. The financial innovations, however, did not reduce the inherent risk but increased it (Santoro & Strauss, 2012).

Derivative instruments were created to help manage risks and create insurance against a financial downturn. In the period leading to the 2008 financial crisis, the intentions of the derivatives have been entirely altered. The derivatives were initially invented to defend against risks and protect against the downside. However, in 2003-2007, the derivatives became speculative tools to make more risk in a move to make more profits and returns. During this period, securitized products which were difficult to analyze and price were traded and sold. Additionally, many positions were leveraged with the aim of maximizing the profits gained from trading the derivatives.

Banks created securitized instruments and sold them to investors. The Federal National Mortgage Association rolled out a concerted effort to make home loans more accessible to citizens with lower savings than the required amount by the lenders. The reasoning behind this idea was to help each American citizen acquire the American dream of home ownership.

However, the banks issued poor underlying credit quality which was passed on to the investors. The information that the rating agencies offered the investors about the certification of the quality of the securitized instruments was not sufficient (Allen, 2013). Usually, derivatives ensure against risk if used correctly, in the case of the events leading to the financial crisis of 2008, neither the borrower nor the rating agency understood the risks involved.

In the turn of events in the meltdown, the investors got stuck holding securities that proved to be as risky as holding the underlying loan. The banks were as well stuck because they held many of these instruments as a way of satisfying fixed-income requirements. They used the assets as collateral.

Financial institutions incurred write-downs during the crisis. A write-down refers to the reduction of the book value of an asset because it is overvalued compared to the prevailing market value. In the events leading to the financial plunge in 2008, assets were overvalued, and the financial institutions and investors felt an enormous negative surprise for holding these “safe instruments.”

In the years leading to the financial plunge, banks borrowed funds to lend so as to create more securitized products. Consequently, most of the instruments were created using borrowed capital or margin meaning that the financial institutions did not have to issue a full outlay of capital. The use of leverage (the use of different financial instruments or borrowed capital like margin to increase the potential profit of investment) magnified the crisis.

Credit default swaps also played a part in the crisis. Unlike options and futures, CDSs are traded in over-the-counter (OTC) markets meaning that they are unregulated. In the period before the financial bubble, the advantageous leverage, and convenience of the CDSs made dealers rush to issue and purchase CDSs written only in debt that they did not own.

The derivatives on different underlying assets are traded in unregulated markets. Derivatives such as CDSs are not widely understood since they are not exchange traded (Allen, 2013). Counterpart default risk in OTC markets produces a series of inter-dependencies among market actors and creates room for risk volatility. The result of this is a systemic risk as witnessed in 2008 in the case of Lehman Brothers Holdings Inc. the lack of transparency in the OTC markets played a part in the occurrence of the economic bubble in 2008. The OTC derivatives and risks associated with them were priced incorrectly, and it overwhelmed the financial market during the recession.

References

Allen, S. (2013). Financial risk management. Hoboken, N.J.: Wiley.

Bloch, E. (1989). Inside investment banking. Homewood, Ill.: Dow Jones-Irwin.

Landuyt, G., Choudhry, M., Joannas, D., Pereira, R., & Pienaar, R. (2009). Capital market instruments ;Analysis and valuation. Basingstoke: Palgrave Macmillan.

Markham, J. (2002). A financial history of the United States. Armonk, N.Y.: M.E. Sharpe.

Santoro, M. & Strauss, R. (2012). Wall Street values. Cambridge: Cambridge University Press.

Other Relevant Posts

2008 Financial Crisis

Corporate Decision Making Capital Structure Financial Markets

Finance Dissertation Topics

Did you find any useful knowledge relating to the analysis of the stock market crash and global financial crisis in this post? What are the key facts that grabbed your attention? Let us know in the comments. Thank you.

Investment Appraisal Techniques

Investment Appraisal Techniques

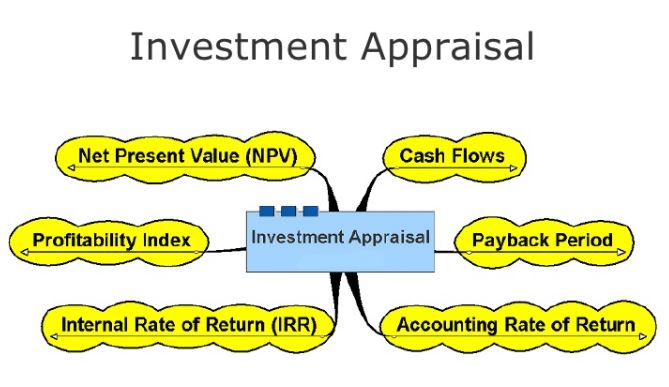
Investment appraisal is normally undertaken by a company before committing to any form of high-level capital spending. The appraisal has two main features including the assessment of the level of returns expected that could be earned from the investment made and an estimate of the future benefits and costs in the span of the project (Ross et al. 2010). In this regard, long-term forecasting is important for estimates of future benefits and costs especially in the purchase of the non-current asset. There are several techniques for investment appraisal, but the two most basic include the payback and return on capital employed (ROCE).

ROCE follows the same principle with the accounting rate of returns as they both relate the investment and the accounting profits (Lumby & Jones 2001). It is computed by getting the percentage of average pre-tax annual profits to the initial capital costs. The method has the advantages of simplicity, especially in the computation. This is because it gives a percentage that indicates the rate of return expected from an investment that is familiar to the management. Also, the technique can be easily linked to other accounting measures (Lumby& Jones 2001). However, the method has disadvantages in that it cannot account for project life, the timing of cash flows and mostly varies depending on policies of accounting employed. Additionally, the method ignores working capital and fails to measure the absolute gain attained while it still lack definitive signal for investment (Watson & Head 2010).

Examples

The ROCE technique is quite popular in the assessment of the business performance after the investments are completed (Haka 2006). This technique is widely used as a measure of the business performance as well as to measure the performance of the management (Lumby & Jones 2001). It is most commonly used in the privately owned businesses as it depicts an increase of wealth for the owner. Also, it can be applied in the expression of the financial goals of a business (Watson & Head 2010). Both independent and mutually exclusive projects can employ the ROCE technique. For example, if a project needs an investment of $800,000 and earns cash inflows of 100, 200, 400, 400, 300,300, 200 and 150 in terms of thousand dollars in a span of seven years.

In addition the assets will be sold at $100,000 at the end of the seven years. The ROCE for this project will be 18.75%. The decision rule as to accept the project or not is determined by looking at the expected ROCE and the hurdle rate from the management. If the expected ROCE is more than the target rate, then the project is accepted (Haka 2006).  The popularity of this techniques has however been declining most probably due to the inflation rates that have led to higher interests rates making the decision-making process difficult. In this case, the method is best suited for short-term business approaches (Haka 2006).

Investment Appraisal Techniques

Payback period, by definition, is the rough estimate of the time taken to recoup the investments made in a project (Lefley 1996). This technique has two variants: discounted and simple payback periods. The periods are calculated by computing the quotient of initial investment divided by annual cash flow (Lefley 1996). This investment appraisal method has the advantages of simplicity and can use the cash flows and not the accounting profits. This is because the profits in the company cannot be sent and are subjective (Watson & Head 2010). Also, cash is used as the dividends have to be paid. For instance, an expenditure of $2million to get cash inflows of $500,000 per year for some seven years can be assessed using payback. The estimated period will be 4 years and the cumulative cash flow would change over the years. The decision rule in using payback is that the objects that pay up to the specified target payback should be accepted (Wambach 2000). Also, the fastest paying option is always considered.

Also, payback has proven to be very useful in some conditions such as in the improvement of the investment conditions and adaptation to the rapidly changing technology (Lefley 1996). Additionally, the technique maximizes the liquidity, increases company growth while still minimizing the risk.

Comparison of the Two Methods

Despite the numerous advantages, the payback method also has some limitations (Wambach 2000). It does not take into consideration the returns that occur after the period and also disregards the cash flow timings although this can be done by the discounted payback period. In the same regard, it does not provide a definitive investment signal making the method subjective (Lefley 1996). Lastly, the payback method does not take into account the profitability of the project.

The best of the methods in this case would be the payback. This is especially because of the cash flows involved in the projects. The method puts into consideration the time as well as the value for money. Payback is also invaluable especially in the world of unlimited resources and the information provided is understandable (Lefley 1996). ROCE and payback period are both classical techniques in investment appraisal (Wambach 2000). Industries are divided among the two methods although it is possible to utilize both although the non-finance managers prefer to use ROCE (Ross et al. 2010). In this regard, two decisions could be made. For instance, a project could be accepted if the ROCE is below 13% and it can payback within four years (Watson & Head 2010).

Conclusion

The forecasts are important for any business before embankment of any project. Although the investment appraisal may but produce accurate results, it would be important to use as many techniques to avoid losses. Spending on too much on current assets is unrealistic, and the forecasts need to be very careful in order for the best possible value to be gotten. Although several methods for the investment appraisal exist, the return on capital employed and payback remains the most popular one especially with the managers with low skills on finances.

References

Lefley, F 1996, ‘The payback method of investment appraisal: a review and synthesis’, International Journal of Production Economics, 44(3), 207-224.

Wambach, A 2000, ‘Payback criterion, hurdle rates and the gain of waiting’, International Review of Financial Analysis, 9(3), 247-258.

Lumby, S, & Jones, C 2001, Fundamentals of investment appraisal, Cengage Learning Business Press.

Haka, S F 2006,‘A review of the literature on capital budgeting and investment appraisal: past, present, and future musings’ ,Handbooks of Management Accounting Research, 2, 697-728.

Ross, S, Hillier, D, Westerfield, R, Jaffe, J, & Jordan, B2010,‘Corporate Finance’, Second Edition.

Watson, D, & Head, A 2010,Corporate finance: principles and practice, Pearson Education.

Other Relevant Blog Posts

Theories of Finance

Where Can I Find Finance Dissertations

Finance Dissertation Topics

If you enjoyed reading this post on Investment appraisal techniques, I would be very grateful if you could help spread this knowledge by emailing this post to a friend, or sharing it on Twitter or Facebook. Thank you.

Financial Ratios Financing Constraints

Impact of Financial Ratios and Financing Constraints on Firms

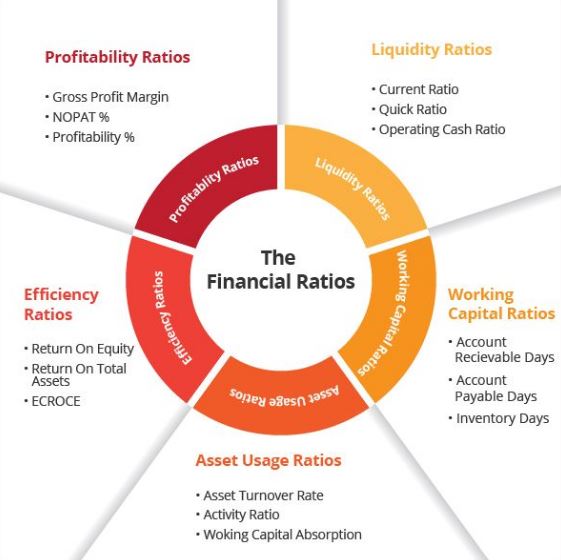
Importance of financial ratios and financing constraints on modern business. The target audiences of this paper are investors looking for financial investment options and small business firms seeking growth.  Therefore, the article and information might be contained in a financial magazine such as wall street journal. The goal of this paper is to inform audiences on the important financial ratios, and how they are important in determining whether a company is worth investing in or not. Any business owner will want to find out the performance of his or her company in order to make informed management decisions.

In addition, an investor will want to have accurate financial position of any business firm for investment decision processes. In this regard, business organizations and financial analysts use a variety of analytical tools that are aimed at comparing the existing relative strengths and weaknesses of their businesses. These basic tools and techniques have enabled the investors as well as the analysts to develop fundamental analysis systems (Butzen & Fuss, 2003). Therefore, ratio analysis was developed as a tool that established the functions of quantitative analysis in the financial statement numbers. These ratios link the financial statements and determine figures that are comparable between sectors, companies, and across industries. Therefore, financial ratios have a significant financial analysis technique that is used for comparative analysis.

Financial Ratios and Business Growth

Small and growing business firms use financial ratios to determine how their businesses perform.  A significant financial ratio is the activity ration that is used in measuring how companies are efficient in utilizing their assets (World Bank, 2005). Therefore a negative ratio will force a company or an organization to either increase or decrease their assets or liabilities. These ratios are widely used by investors who can easily check out the overall operation of a prospective company for investment decisions (Harrison et al, 2002). If the overall performance of a company is determined to be poor, a company may lose investor confidence and as a result, lose business.

In addition, activity ratios are deemed to be turnover ratios that are associated with a balance sheet line item and an income statement line item. Generally, income statements are used for measuring the performance of any company, but for a specified period of time. However, the balance sheet provides data for a specific point in time. The advantage of using activity ratios is that they are able to give an average figure between the two financial statements. This means that companies or organizations are able to determine the rate of turning over their liabilities or assets. This helps the companies to control their receivables or inventories per year (Harrison et al, 2002).

Moreover, there are inventory turnovers that are used in the management effectiveness of any business organization (Butzen & Fuss, 2003). This ratio is determined when the cost of goods sold is divided by the average inventory. In this regard, a company is able to know whether its inventory is sold at a higher rate, when the turnover is recorded to be high.

Financial Ratios Essays

This ratio is then significant in giving companies signals for inventory management effectiveness. In addition, this kind of inventory ratio communicates that there are less resources which are tied up in the company’s inventory (Butzen & Fuss, 2003). However, it is also important to understand that an unusually high turnover means that the company’s inventories are too lean. Consequently, the management discovers that the company may be ineffective in keeping up with the demand that is increasing (Harrison et al, 2003). Therefore the management is forced to act swiftly in adjusting the company’s operations to fit a favorable inventory ratio. Investors are keen in checking out companies with high inventory turnovers since it means that that specific industry gets stale quickly, thus an attractive investment option.

Another significant financial ratio is the receivables turnover ratio, that enables a business organization determines how fast it collects the bills that are outstanding (Harrison et al, 2002). This specific ratio determines the effectiveness of any company credit policy towards its customers. In this regard, negative receivables will force a company to have stringent credit policies that are aimed at ensuring that bills are collected as easily and fast as possible (Butzen & Fuss, 2003). This particular ratio is achieved by dividing the all the net revenues with the average receivables. In this case a company is able to know how many times per financial period, it is able to collect all its outstanding bills and have the cash used in the operations of the business.

However, it is important for a prospective investor to understand that a high turnover does not only indicate that the company is operating in the best interests of its customers. A high turn over may also indicate that the business company policies are too stringent and thus the company is missing out on sales opportunities to its competitors (Harrison, et al, 2002). Alternatively, a low turnover or which is seen declining means that the company’s customers are struggling with the credit policy that is set out by the company and thus are having trouble paying their bills. In this regard, this turnover ratio is very significant when any company is developing its credit policy.

Creditors are able to measure how effective companies are in paying off their financial obligations, when determining whether to extend their credit facilities to them. The financial ratio that is used in this case is the liquidity ratio, that helps establish any company’s ability in meeting its financial obligations usually short term financial obligations (Harrison et al, 2003). However, it is important to understand that the level of liquidity is not standard and thus varies from different existing industries. One example is a business that runs a grocery store; this business entity, usually demands cash on a regular basis in order to run its business operations. In contrast, a technological run store will need less operational cash in the daily running business operations. In addition, every business has its own unique trend over the liquidity ratio that is recorded over a financial period.

When a company wants to expand its business operations, it is the ideal option of seeking long term financial services. In this regard, a company is able to measure or determine its payback ability by calculating its solvency ratio. This is an important financial ratio that either allows a company to get long-term financing or to stay steer on it. This ratio is able to do this because it provides an insight to the capital structure of any company as well as its existing financial leverage that is being used by a firm (Butzen & Fuss, 2002). In the recent years, investors use the insolvency ratio in determining whether firms have adequate cash flows that are important in paying fixed charges or even the interest payment. Therefore, a company that presents low cash flows is deemed to be overburdened with its debts. In this scenario, investors may opt out and the company’s bondholders are likely to push the company into default.

Ratios are an important tool of making profitable financial decisions from any angle, whether as an investor or as a business firm. All these financial ratios have their own distinct impact of firms and business organizations. They present financial constraints that may hinder firms from accessing venture capital or financial aid from companies. In addition, other constraints may include rising interest rates as well as inflation (World Bank, 2005). Therefore, it is very stringent for companies strive in building contingencies in their cash flow budgets that are important in dealing with such adverse changes that may occur in the financial environment. In addition, it will be a bad idea for any start up firm to rely fully on loans from financial institutions such as banks or funding from venture capitals for their business plans (World Bank, 2005). This is because there could be a rise of financial constraints that would be unfavorable for the company. A financial constraint such as inflation could mean that raw materials or labor costs may consequently increase to higher levels causing such start ups to close business.

References

Butzen P., Fuss, C. (2003) Firm’s Investment and Finance Decisions: Financial Ratios Theory and Practice. New York: Routledge

Harrison, A., McMillan M., & Love, I. (2002). Global Capital Flows and Financing Constraints. New York: Rowman & Littlefield Publishers.

World Bank. (2005). Financial Ratios in the Finance Sector: A Handbook. New York: International Monetary Fund.

Other Relevant Blog Post

Theories of Finance

Where Can I Find Finance Dissertations

Finance Essays

If you enjoyed reading this post on financial ratios and financing constraints, I would be very grateful if you could help spread this knowledge by emailing this post to a friend, or sharing it on Twitter or Facebook. Thank you.

Capital Structure Financial Gearing Project

Negative Effects of Financial Gearing

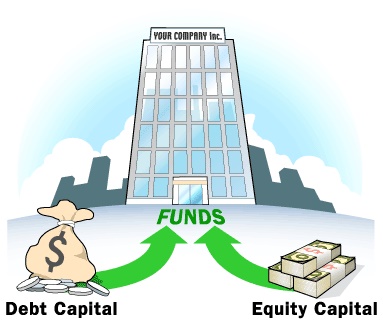
Capital structure is one of the paramount elements which a firm should consider when undertaking its short term and long term projects. Well, the balanced capital structure enables the company to achieve strike off the balance of growth‚ Continuous improvement and growth‚ risk mitigation thus ensuring production goes on uninterrupted. For this matter the paper analysis the factors to consider when setting the capital structure‚ advantages of proper debt-equity management and lastly the risks of having improperly balanced capital structure when financing various operations. Finally‚ evaluation of best financial management techniques which can help to ensure organizational goals are achieved without compromising its operations.

Enterprises should maintain the proper balance of the capital structure which entails attaining the reasonable level of equity-debt level. Furthermore‚ it is recommendable that there should be the efficient matching of liability to asset level, this implies that only long-term projects should be. Financed by the long-term liabilities and vice versa for short-term projects which should be funded by use of the short-term sources of the funds. Lack of this aspect will compromise the value of the firm which can lead to financial distress in its advance levels‚ as debt capital is very much expensive source of fund (Ding, Wu, & Zhong, 2016‚p 328).

For instance use the short-term loans to build rentals with the anticipation they will raise some money which can be used to service the loan repayment can ditch the firm in financial problems especially when the building fails to get occupants. It should be noted that returns on some projects are probabilistic whereby there is no consistency of their returns as market forces of demand and supply are unpredictable. Thus market assessment and evaluation should be carried out to prevent such advance results which can jeopardize the firm’s operations.

Factor to Consider When Setting Appropriate Capital Structure

In recent past, there has been the development of various theories to expound on factors which should be considered when determining proper level debt-equity ratio to be maintained by the company (Öztekin, 2015 ‚p 302). Most of the theories suggest that before choosing the capital structure to use firms should consider various factors which include the following;-

Cost-benefit‚ the companies should come up with the capital structure which yields the highest return with the least risk involved. For instance, if the shareholders capital is capable of financing the operations of the firm or they have sponsors. Dong, Yanmin, Kaul, Charles ‚Yui, and Tsang, (2016‚p 200) noted that having these organization helps in achieving proper control and management of capital structure   The management should opt to maintain the high level of equity to debt ratio in its capital component. Furthermore‚ depending on the risk propensity and attitude of the management one can opt to go for debt capital due to tax shield benefit.

Financial flexibility‚ this involves ease at which the enterprise can interchange debt to equity without possible cases of financial distress. For instance, promptly the airline industry is capable of making significant returns‚ while at bad times it can consider raising working capital through debt capital.

Management style may be classified as either aggressive or conservative. Aggressive managers have the appetite for risk‚ hence taking the risk for them is not a big deal (Zawadzka, Szafraniec-Siluta, & Ardan, 2015‚p 358). For conservative managers, they are risk averse, so they will tend to avoid debts.

The growth phase of the firm -The companies in growth stage tend to finance their operations through debt capital while well-established firms prefer equity capital more than debt capital.

Market condition‚ if the company is raising funds to finance new plant having high market volatility. In such situation, there are high chances of the company to land in financial distress whereby the returns accrued from the plant are not sufficient to service the loans.

Illustration

Assuming that a company has borrowed £5,000,000 to be repaid for eight years at an interest rate of 12% pa to invest in both shares and real estate. The repayment will be systematically be amortized as follows:-

Year

Opening Balance Annual repayment Interest Principal

Closing balance

1 5,000,000 1,006,514 600,000 406,514 4,593,486
2 4,593,486 1,006,514 551,218 455,296 4,138,190
3 4,138,190 1,006,514 496,582 509,931 3,628,259
4 3,628,259 1,006,514 435,391 5,711,223 3,057,136
5 3,057,136 1,006,514 366,856 639,658 2,417,478
6 2,417,478 1,006,514 290,097 716,417 1,701,061
7 1,701,061 1,006,514 204,127 802,387 898,674
8 898,674 1,006,514 107,841 898,673

Amount to be repaid annually is 5,000,000=PMT (1-1/ (1+r)/r

£5,000,000=PMT (1-1/ (1+0.12)8)/0.12=£1006514.

Assuming after the company bought shares the value of returns on stocks deteriorated and stabilized at £50,000 at the interest rate of 10%. The present value can be computed by use of present annuity formula as follows

Amount=50,000 (1-1 / (1+0.10)8)/0.10=266746

From above illustration the due to unforeseen market condition during loan acquisition. The firm will be unable to meet the debt obligation as even cumulative returns for eight years cannot pay for the loan in the first year. As there is the deficit of 1,006,514-266,746=£749,768.

Advantages of Above Arrangement

Robust accessibility of capital‚ efficient utilization of the debt capital can help the firm achieve the significant level of growth especially when the management have ventured in the viable industry. For instance ‚ by venturing in real estate the company will be capable of recouping the money required to service the loan in a very short. After which it can invest back the capital accumulated. The net effect of this will be multiplier effect‚ which will help the firm achieve its goal for sustainable development.

Best for buyout and acquisition for strategic growth‚ due to the risky nature of the debt capital it is only effective when the firm has short term strategic needs which are geared towards achieving a particular short viable objective. For instance buying of shares in the profitable company.

Tax shield benefit- debt capital is tax deductible thus a high level of returns to shareholders.

Disadvantage of Above Arrangement

Costly‚ for instance in case the enterprise has secured the loan to invest the in the financially geared products such as high-yield bonds and leveraged loans. For this matter managers must monitor the interest effectively that it does not suppose the intended rate of return on investment (Homburg, 2014‚ p 414). For investors to be convinced to take such investment risk, they will need compensation regarding premium of which in case of the unfavorable market condition the firm may be unable to raise.

It is the risky source of finance‚ even though financial gearing is one of the effective methods of financing operations of the firm. Extreme levels increase the risk level of the company to land at the lead to financial distress which at the advanced level can lead the Company to be put into receivership. For this reason, managers must ensure proper maintenance of liabilities and assets trend off is maintained to prevent adverse results which can jeopardize the firm’s operations. Hence, leading to financial failure which signifies the failure of the enterprise.

The sophisticated analysis required before taking loans. Most financial institutions need proper business plan from borrowing individuals and companies. In such situation, the borrowing entity may be compelled to hire financial analyst consultant to do some market feasibility and come up with the business plan which is very expensive, and it does not guarantee the proposal will be accepted by the prospected lending institution.

Financial Gearing and Capital Structure

Conclusion

Going by the above discussion, it is clear that although using debt capital to finance operations has advantages. Such as Powerful accessibility of capital due to tax shield benefit and is best for buyout and acquisition strategic growth. It has inherent risks and disadvantages which can lead to financial distress hence bankruptcy. Thus‚ management must ensure proper trend off of risk and returns of borrowed loans and anticipated projects to be financed by such debt.

References

Ding, X. (Wu, M., & Zhong, L. 2016. ‘The Effect of Access to Public Debt Market on Chinese Firms Leverage’. Chinese Economy, no 49(5), pp 327-342.

Dong, C., Yanmin, G., Kaul, M., Charles Ka Yui, L., & Tsang, D. 2016. ‘The Role of Sponsors and External Management on the Capital Structure of Asian-Pacific REITs’: The Case of Australia, Japan, and Singapore. International Real Estate Review, no 19(2), pp 197-221.

Homburg, S. 2014. ‘Overaccumulation, Public Debt and the Importance of Land. German Economic Review’, no 15(4), pp.411-435.

Öztekin, Ö. (2015). ‘Capital Structure Decisions around the World: Which Factors Are Reliably Important?’. Journal of Financial & Quantitative Analysis, no 50(3), pp 301-323.

Zawadzka, D, Szafraniec-Siluta, E, & Ardan, R 2015, ‘Factors influencing the use of the debt capital on firm, Research Papers of the Wroclaw University of Economics / Prace Naukowe Uniwersytetu Ekonomicznego we Wroclawiu, no. 412, pp. 356-366.

Other Relevant Blog Posts

Where Can I Find Finance Dissertations

  Theories of Finance

Corporate Accounting Dissertations

Click Here To View Finance and Accounting Dissertations

If you enjoyed reading this post on negative effects of financial gearing and capital structure, I would be very grateful if you could help spread this knowledge by emailing this post to a friend, or sharing it on Twitter or Facebook. Thank you.

Revenue Recognition Construction IAS 11

Revenue Recognition

A Summary of How Revenue is recognized within the Construction Industry under IAS 11

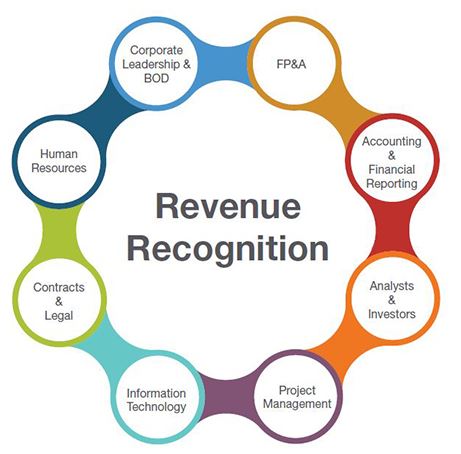
Title: Revenue Recognition: Construction contracts are designed to meet specifications for the negotiations on how assets are constructed or combined to meet their ultimate objectives (Buschhüter, Michael & Andreas 2011). Contract constructions may involve fixed prices where some are subjected to the cost escalation costs.

On the hand, a cost plus contract involves reimbursements or allowable and percentages of costs or the fixed rates present. The changes were made to meet the standards of Financial Accounting (IFRS 15 2014). Revenue is considered to be income earned from everyday activities as it goes by different names such as royalties, dividends, interest, fee or sales.

Revenues that are to be recognized would be from the selling goods, providing services royalties and interest. However, in this case, revenue is to be recognized from the construction of contracts. Construction contracts may be either fixed or cost plus contracts or a combination of the two (IAS 11 2011).

In this regard, a contractor needs to identify and determine what contract to use to know when to recognize revenue and costs as well. When the outcome can be properly estimated, the contract revenues and costs would be recognized as revenues and expenses respectively at the end of the contract period. A loss is also recognized as an expense by the accounting standards.

In fixed price contracts, construction contracts are estimated reliably once total contract revenues are reliable. The revenues are considered as benefits since the effects will be felt positively by any business. Stages of contract completion, as well as, the contract costs have been reliable to meet the standards. All contract costs are to be measured reliably to account for the actual contract costs that would be incurred when compared.

Similarly, for cost plus contract to be enforceable, the economic benefits of the contract have to be passed to the entity. The costs have to be also clearly and easily identified for measurements to be done reliably (IFRS 15 2014). The recognized revenue at the end of a contract is considered to be the percentage of completion. This whereby the contract revenues are matched with the contract costs and then reported in the books of account.

Revenue Recognition
Revenue Recognition

Afterward, the contract revenues and costs are recognized as revenues costs in the profit and loss account. The expected excess of costs over revenues is treated as expenses. If the outcomes are not measured reliably, the revenues will not be recognized and perhaps not even recoverable in the business. An entity will then disclose the revenues recognized during the accounting period as techniques of arriving at the revenues will be recognized as well.

A Description of the Process of Developing New Standards IFRS 15

The International Financial Reporting Standard had to be formed by the Internal Accounting Standards Board; IASB to provide rules and procedures on how to account for revenues that are from customers. There were significant differences between IASB and the IFRS when it came to the definitions of revenue.

Even though they were almost similar, the different understanding of revenue resulted in different ways of treating revenue in financial accounting. The IASB thought they had not given enough revenue standards, policies and procedures on how revenue was treated (IAS 18 1993).

The IASB began working on the issues to try and formulate ways it could solve the issue from 2002.Their first review paper was released in 2008 as they further discussed it and gathered information from relevant sources. Afterward, a release on the exposure draft was done proposing the new accounting standards in 2010 and 2011. After a long process of deliberations and reviews that took several years, the IASB issued the final standard on 28th May 2014.

Changes made about the IAS 18 included recognizing and measuring financial tools revised in 2003 and the 2004 revision of insurance contracts. In 2007, the presentation of financial statements was reviewed through amendments in the different terms used. Their first issued review in 2008, involved investment costs in jointly controlled entities and subsidiaries as well as improvements on the IFRS. The same year also saw IFRIC agreements on issues relating to the constructions of the real estate.

The IFRIC 15 also dealt with issues of the non-monetary contributions by investors in entities that are jointly controlled as they evaluated all legalities in leasing or substance transactions. Barter trade and service concession agreements were also made as they issued customer loyalty programs in 2007 (IAS 18 1993). The IFRS 15 model follows procedures that begin with the; identification of the contracts as well as all individual parties involved.

Transaction prices are also determined as the prices are allocated to the different obligations in accounting. Revenues are finally recognized as the performance obligations are fulfilled. The amount of revenue to recognize and when acquiring costs are capitalized as assets are under the guidelines of the IFRS 15. Any of the expenses not capitalized as assets are considered to be expenses incurred. After all proper recognitions are reporting is done, financials are to be properly disclosed by the company.

Why the Process of Developing New Standards has proven to be difficult and Time-consuming

The new revenue recognition standards had left out key areas that bring in revenue and had not been recognized. New standards on how to recognize revenue had to be set for businesses to follow by the relevant bodies. The objective of the new set of rules and procedures is to explain how the different revenues would be treated.

Revenue recognition is recognized when it estimated to bring economic benefits that are measurable to the business in the future. Therefore, practical guidance is given on how the criteria will be met. The International Accounting Standards Board adopted previously issued the construction contracts and the new standards of recognizing revenue.

IAS 18 was put in place to replace the former methods of recognizing revenue while the IAS 11 replaced some accounting rules on the construction of contacts (Buschhüter, Michael & Andreas 2011). This is to help in knowing how to treat costs and revenues that are associated with the nature of activities undertaken.

Also, due to the then existing rules, changing to new standards had to take long processes of deliberations that were time-consuming. Steps had to be followed as described above as company’s found it hard to easily and quickly adapt to the new set of rules. The new set rules had to be then applied first to see if they would meet the specifications with no interference of other accounts that would result in imbalances in the financial statement and misappropriation and misallocation of resources.

Changing one side would have to result in changing of the other side to cancel out the effects. For instance, in ledger accounts, a debit entry has to be followed a credit entry and vice versa is also true.

What people do not know is that different firms have different accounting rules they follow. A majority however, follow the international standards while others follow the U.S. GAAP principles (Kieso, Jerry & Terry 2010). Unlike the U.S. GAAP, the International Financial Reporting Standards does not always give extensive regulation prompting the need of having some exercises in judgments in some instances. The U.S. GAAP accounting is based on standards while the IFRS focuses more on principles.

The accounting differences have made the financial comparison between different organizations difficult. For instance, actuarial gains and losses are treated differently. They are treated as off-balance sheet items by the IFRS standards unlike under the U.S GAAP.

The off-balances in the balance sheets would cause volatilities and fluctuations. Therefore, the IASB is trying as much as it can to harmonize the differences in the standards. This would also take time as the harmonization would require changes in almost every aspect of accounting (IASB 2006). Adaptation by firms would take time as well making it a difficult and a long, tedious process.

A Summary of how the New Standard IFRS 15 would Deal with a Construction Contract where Construction Happened Over One Accounting Period

The important principle of IFRS is that a company would have to recognize revenue for it to be related to the transfer of the commodities and services that were promised and what the company is expected to get. Services rendered depend on the agreement of the specific time it should cover. The period might exceed one accounting period as would be expected.

An accounting period is often considered to take one year. This, therefore, means that more than one accounting period takes more than one year. The work done at construction contracts usually take more than one accounting period. Therefore, rules have to be set that best suit the situation. One of the methods is to recognized revenues or profit at the end of the contract. This would be through following the IAS 18 – Revenue (IAS 18 1993).

Revenue Recognition and Profit

Recognizing profit at the end of the period does not show that profit was accrued. Under the IAS 11 all revenues and costs will be matched to the accounting period and documented at the end of each financial period (IAS 11 2011). Recognition of profit at the end of the contract would see the company reporting spikes or rises in profits that may not often be matched with the accruals. This is because the revenues would have accumulated to amounts exceeding what would have been recognized in one accounting period (Ursachi, Antonela, & Geanina 2014).

In this regard, revenues and costs are only recognized once estimations of the outcome are reliable. As stated earlier, properly estimated outcomes from contracts should be reliable for use and interpretation. An expected contract loss should be recognized immediately. The completion stage would be calculated on the basis of sales, costs, and physical proportions.

Revenue recognition done at the end of the construction contracts is known as the percentage of completion method. The reported revenue and costs would later be credited to the proportion of work that was completed (IAS 11 2011). The contract revenue is recognized as revenues while the contract costs as expenses in the profit and loss accounts. Similar to when accounting was done in one accounting period, expected amount that exceeds when contract costs are more than contract revenues are treated as expenses.

Where Can I Find Finance Dissertations?

Reference List

Buschhüter, M & Andreas S 2011, ‘IAS 11–Revenue Recognition & Construction Contracts’, Kommentar Internationale Rechnungslegung IFRS. Gabler, 374-391.

International Accounting Standards Board Revenue Recognition: (IASB) 2006, ‘International Financial Reporting Standards (IFRS’s): Including International Accounting Standards (IAS’s) and Interpretations’, International Accounting Standards Board.

International Accounting Standards Committee 2010, Revenue Recognition – ‘IAS 18’ Revenue, London: IASC 1993.

Kieso, E, Jerry W, & Terry W 2010, Intermediate accounting – Revenue Recognition: IFRS edition. Vol. 1. John Wiley & Sons.

Ursachi, Antonela, & Geanina M 2014, ‘IFRS 15–revenue from contracts with customers – Revenue Recognition,’ 2nd International Conference-2014.

View Finance Dissertation Collection Here

If you enjoyed reading this post on Revenue Recognition, I would be very grateful if you could help spread this knowledge by emailing this post to a friend, or sharing it on Twitter or Facebook. Thank you.