Foreign Outsourcing

Foreign Outsourcing

Foreign outsourcing is a byproduct of the globalization where societies and the cultures across borders have become integrated. This integration had been through globe-spanning network of communications and executions of the national economies. As a result, the economies integrated into international economy through trade, cash flows, foreign direct investments, migration and spread of the technology. However, national economies integration has given rise to controversies owing to outsourcing. Though, it appears to the economists to be an opportunity for states to gain growth through comparative advantage aspect, there are various critiques on the same regarding its demerits. For this case, therefore, it is a twofold-problem which seems debatable among the persons of US and across nations (Snyder &Jeremy 2010, p. 20-22).

Among foreign outsourcing companies, for instance, Delta airlines outsourced 1,000 jobs to India in search of cheap labor. The company realized $25 million in savings and hence allowed the company to add 1,200 reservations and sales positions as well. Similarly, positions in IT had gone offshore with a total of 400,000. US positions recorded. Meanwhile, a total of US employment increase from 129 in 1993 to 138 million in 2003 mainly in services was also recorded. This way, it reveals that despite of heated public debate, outsourcing in US America is very positive to the American economy.

This paper, therefore, takes into consideration of the background of the study; US companies move to outsource factories to undeveloped nations. Besides, it critically looks into the business ethics regarding the barely faire wages that employees receive relative to their performance.

Foreign outsourcing background

It is a practice which had gain fame in the recent past decades as a way that is commonly used by different companies to reduce labor cost. Outsourcing is an effective cost-saving strategy used by transferring portion companies’ work to the outside suppliers rather than completing it internally. It is a practice which relies on the comparative advantage principle; at times it is more affordable to purchase a good or source labor from companies with comparative advantages rather than to produce internally.

Benefits of Foreign outsourcing

Outsourcing jobs to foreign countries has boosted American business to compete in the global economy. As the world economy has become less restrictive as a result of liberalization, US. companies modify their strategies to meet these contemporary world challenges. Competition in the world economy escalates the globalization, in turn incorporates the need for outsourcing for cheap labor. This way, outsourcing is a tool used to obtain a competitive edge in a globalized economy.

American trade across border for cheaper labor had been a crucial movement which has made a number of nations strives economically. Especially, its relationship with undeveloped countries had been an essential to their economic growth by a margin. This way, more and more of the American companies are hiring employees abroad hence enhancing job creation in undeveloped countries.

Outsourcing barely pays well

Many aspects of the average American’s good lifestyles can be solely attributed to trade relationship between US and Asia. That is, a significant proportion of clothes they put on, toys they nature their childhood, and given technologies the use at work or homes, was produced somewhere in Asia. Similarly, commerce with developing nations majorly China and Indonesia is as well reportedly crucial for America’s owned progressive economic achievements. Accordingly, manufacturing investments in developing states are in tens of billions of dollars and a huge number of contracted plants with American companies. However, many of Americans are barely aware that their appetite for consumerism fuels to heights controversial industry. Put simpler, just as the manufactured goods are in plenty than to meet the eye, sweatshops are very complicated (Hira, & Hira, 2005, p. 44-56).

Sweatshops are those factories which are considered to have unreasonable authoritative overseas, enforces long working hours with low payments, giving very harsh working conditions which are either physically or psychologically unhealthy. These outsourcing factories barely pay well regarding to the working conditions employees are subjected to. Considering the living wage, which is barely met by outsourcing factories, is a wage required by a million of workers to met their basic needs for survival. However, it is one of the brands which will remain unreality especially where government of state favors minimum wage. On the other hand, minimum wage is the amount of payment legally set as a benchmark by the states. In which it has to be met by the factories in a host country (Linder& Jane, 2004, p.75-90).

Reasons why outsourcing companies pay minimum wage

There exist some excuses why these sweatshops barely pay well for a living their employees overseas. Despite of the escalating food, energy, housing prices and transport fee around the world outsourcing factories has left workers a dire poverty. They barely receive a living wage to gather for their basic needs and those of their family members. Whether these manufacturing firms operate in Bangladesh, Cambodia, China, or in Philippines, their brands use all sorts of tricks to avoid paying their workers a sustainable living wage (Krishnan, 2007, p. 48).

Sweatshops posits that, paying a living wage seems impossible because there is lack of consensus on how to calculate it. However, from the workers point of view the problem has a little sense in this argument. Even though factories cannot agree on the figure many of similar firms had made no attempts to raise wage at all. Over the past years, of this dilemma have been in existence, multi-stakeholders such as Asia Floor Wage Alliance an alliance of 80-plus garment workers unions, workers representatives and the NGOs from six Asian garment producing nations have attempted to reach consensus but have failed in 2009. It is not the case that consensus is impossible to be reached rather it is just that sweatshops does not want to find it. The living wage was a workers buying power figure suggested to companies as a benchmark solution to the dilemma. Majority of the companies even was to the opinion but to date no company has started to officially it as a living wage benchmark (Snyder &Jeremy 2010, p. 20-22)

Outsourcing companies also argues that consumers do not want to purchase more of the products produced in this firms. For instance, consumers pay only a very small amount on their clothing needs. This way, sweatshops argues that it worth nothing however that a garment worker’s wage is merely 1-3% of the total cost of the garments. If a consumer is willing to spend eight Euros for a shirt, then means the worker though in harsh working conditions is receiving 24 cents. This as well is disputable in that doubling this wage would merely be another 24 cents. The consumer will barely realize the increased figure and if the consumer fails to, the factories will neither notice it. These profits have been observed being observed in the sweatshops profits margins and yet workers’ wage is still way below living wage (Krishnan, 2007, p. 48).

Sweatshops argue that low wage payments enable the hosting nations to gain competitiveness. This dilemma is also argues by the government of states giving reasons for setting minimum wage. Simply because, allowing living wage by the states would shun away the benefits from the sweatshops hence losing competitiveness edge. Cheap labor is a factor that entices production in majority of countries. For instance, China population attracts cheap labor force as well as the productivity of the industry is efficient. Contrary, increased wage rate have been an observed factor that boost morale of productivity, reduce absenteeism and employee turnover. This way, paying the workers a living wage is ideal to improve quality and flexibility. For this reason, therefore, allows the enlighten suppliers to retain a competitive edge (Bosniak et al., 2005:40).

Foreign Outsourcing
Foreign Outsourcing

Developing countries are desperate for jobs owing to their unemployment rate. On this note, outsourcing companies hold that they boost these countries significantly as they create job opportunities. It is actually the truth that workers getting jobs at sportswear and garment factories are better than some of the alternatives available to them. The flow of the cash flow from a country into another country has a detrimental impact of paying unfair wage yet they reap massive returns. The slave pay is not at all correlates to the returns realize even though the create employment to most of the developing countries. Generally it is unethical.

Outsourcing payments is unethical

Some of the world leading economists have recognized outsourcing as a necessary step in modernization and development. Jeffrey et al of Massachusetts Institute of Technology have asserted that sweatshops manufacturing in foreign countries, especially, in production of goods like garment and shoes are essential move towards a prosperous economic. This economic growth rate has been evidence in Asian tigers; Korea, Honking, Singapore and Taiwan. A study by University of Santiago de Compostela on the poverty relief and development also indicates that, sustainable international investments have been an economic progress in low income countries (Babin et al., 2012, p. 123-138)

However, foreign outsourcing by garment and footwear factories such as Nike, Converse, GAP, and Levi’s, has been genuinely linked to sweatshops as they are overwhelmingly lucrative. This is because they capitalize immensely on low-wage labor to significantly reduce cost of production. Such factories have been criticized as being involved with other agents, the government of US and developing countries, US corporate business which employs sweatshops labor, and the laborers in the developing countries, in exploitation of the workers. This is because they have been failing to correct the malpractices, in which they are pretty aware of but often claim they are hard to be corrected as purported by NGOs, workers alliances and so forth.

Rawls’ (1971, p.56-70) argument from the veil justice of ignorance would provide a view that foreign outsourcing is unfair and unethical. This is because there are great in equality between the US and the developing states. In developing countries which are relatively worse off the US, the laborers are exposed to the worst working conditions. Besides, it is unfair to as there exists difference in their payment as well. They actually take advantage of the developing country’s desperate need for job. It is true low-income countries are in great need for job creations which outsourcing countries are well-position to provide help. However, outsourcing companies have failed to justify their special obligations on either part of Enterprises Corporation or sweatshops to bare the shift of high wages, good working conditions and so forth.

Even though, outsourcing US companies are not charitable organizations and they are actually subjected to the stiffer market mechanisms, it does not mean that they have to maximize on their returns and fail to regard the socio well-being of its laborers. According to Immanuel Kant’s practical moral comparative posits that human beings ought to be treated as ends in themselves and not only as a means of exploitation to strive (Paton, 1999, p. 19-39). This way, sweatshops are not acceptable at all from their capitalism perspectives to mistreat their labors. It is unethical and unethical to use workers overseas as instruments in the amassing of the ventures profits (Zwolinski & Matt, 2007, p. 689-727)

Conclusion

The controversies surrounding the outsourcing companies in the US labor are suggestive of the ethical challenges. These are inevitable challenges which face US-Asia relationships. Besides, outsourcing companies’ reasons given for low-income payments to sweatshops workers are unethical and not justifiable. Their Laborers are the critical units that constitute and contribute to the nation’s economy at large. For this reason, US and Asia relations contribution to the overall progress needs not to overlook the moral obligations of respecting human rights. It is an essential need to be negotiated by the agents on the incompatibilities between the relative costs and the accruing advantages that are realized as results from their interactions.

Work cited

Babin, Ronald P, and Brian Nicholson. Sustainable Global Foreign Outsourcing: Achieving Social and Environmental Responsibility in Global It and Business Process Outsourcing. Houndsmills, Basingstoke, Hampshire: Palgrave Macmillan, 2012:123-138. Print

Bosniak, L. and others. Working Borders: Linking Debates about Insourcing and Outsourcing of Capital and Labor. Texas International Law Journal, Vol. 40, 2005

Ganesh, S. Foreign Outsourcing as Symptomatic. Class visibility and ethnic scapegoating in the US IT sector. Journal of Communication Management, 11.1: 71-83, 2007

Hira, Ron & Hira, Anil. Outsourcing America: What’s behind Our National Crisis and How We Can Reclaim American Jobs. AMACOM, 2005

Krishnan, J. Outsourcing and the Globalizing Legal Profession. William and Mary Law Review, Vol. 48, 2007

Linder, Jane. Outsourcing for Radical Change: A Bold Approach to Enterprise Transformation. AMACOM, 2004, p.75-90

Mitchell, Edwin T. A System of Ethics. New York: Charles Scribner’s Sons, 2005:485-490. Print

Paton, H J. The Categorical Imperative: A Study in Kant’s Moral Philosophy. Philadelphia, Pa: University of Pennsylvania Press, 1999:19-39.

Snyder, Jeremy. “Exploitation and Sweatshop Labor: Perspectives and Issues.” Business Ethics Quarterly 20.2 (2010)

Zwolinski, Matt. “Sweatshops, choice, and exploitation.” Business Ethics Quarterly (2007): 689-727

Rawls, John. A Theory of Justice. Cambridge, Mass: Belknap Press of Harvard University Press,  1971:56. Internet resource

View Finance Dissertation Topics Here

Currency Risk Dissertation

Currency Risk

Currency risk is basically a risk that arises when a price of some country’s currency changes against the currency of some other country (Alastair, 2013). Whenever the companies or investors have their business operations or assets across their national borders, they are exposed to currency risk if they do have their positions hedged (Stephens, 2003). In these modern times of heightening currency volatility and increasing globalization, changes on the currency rates or the exchange rates causes to have a substantial influence over the profitability and operations of companies and even the government in those countries (Graham, 2014). The volatility of the exchange rates or currency rates not only affects the large corporations or multinationals, but also the medium and small sized businesses that operate only in their homeland (Horcer, 2011).

Types of currency risks or exposure

What follows is a brief account of different types of currency risks or exposure that are faced by companies and governments due to the volatility of the currency or exchange rates.

Economic risk

It is among the lesser discussed risks by researchers and scholars, but still is an evident one and has a substantial presence. Such a risk is basically caused by effects of unanticipated or unexpected fluctuations in currency on the future market value and cash flows of a company (Coyle, 2001). The impact of such a risk is long term is nature. It can have a substantial impact on the competitive position of a company even if the company is not making overseas sales or operating overseas. The source behind the economic risk is the change in competitive strengths of exports and imports (Plaza, 2011). This can be understood with an example.

For instance, if a company exports from UK to a country in the Eurozone and the price of the Euro weakens against the pound sterling i.e. it comes from 1.1 euros to 1.3 euros per pound sterling. This is a weak position because one would have to give 0.2 Euros more for one pound sterling. This means that a product from UK priced 100 pounds would cost 130 Euros instead of 110 Euros. This means that the goods from UK would become less competitive in the European market.  On the other hand, the goods that are imported from Europe to UK would cost lesser than previously and would make them competitive in the UK market (MOguillansky, 2003).

Methods of risk mitigation for economic risk could be difficult, and especially the smaller companies which have limited international dealings (Hakala & Wystup, 2002). Some of the following approaches in general could be of importance.

  • Try exporting and importing from multiple currency zones and hope that those zones do not all move together, or move together to the same extent. For example, for the six months from January 2010 to June 2010 €/US$ rate of exchange moved from €/US$0.6867 to €/US$ 0.8164. This caused to strengthen the US dollar against the Euro by 19 percent. This resulted in making it less competitive for the USA manufacturers to make exports to a country in Eurozone. However if during the same period, the value of Pound relative to the US dollar moves from 0.6263 to 0.6783, this would have strengthened the US dollar relative the pound by 8 percent. In such a case, he trade from US to United Kingdom would not have been affected so badly(Poghosyan, 2010).
  • Another method here is to make the goods in the countries to which they are sold. This is something which is followed by multinationals. Though in such a case, the raw materials might need to be imported and affected by change in currency rates, but the other expenses such as electricity bills and wages in the local currency would not be subject to the currency risks(Clark & Ghosh, 2004).

Translational risk

The impact of currency rate fluctuations on the company’s fiscal statements results in translational risks. It is especially the case when the company features foreign subsidiaries (Matsukawa & Habeck, 2007). This risk is normally short to medium term. If the subsidiary of a company is in some country where the currency weakens, the value of assets of such subsidiary in the company’s consolidated accounts will weaken (Homaifar, 2004). The effect is not severe as it does not impact on the day to day cash flows. However, scholars and practitioners have reserved the translation risk usually for the consolidation effects (Stephen, 2003).

The exposure can be partially mitigated through funding of the foreign subsidiary through a foreign loan. For instance, take a USA subsidiary of a company which has been set up by the parent company using equity finance. The financial position statement of the company would appear something like this:

Current assets – 0.5 million US dollars

Non-current assets – 1.5 million US dollar

Equity – 2.0 Million US dollars

Now if the US dollars, the total assets of the company would have a lesser value as a result.

However, in case if the subsidiary for example was formed through using 50 % US borrowings and through 50 % equity, the financial position would be:

Current assets – 0.5 million US dollars

Non-current assets – 1.5 Million US dollars

The breakup of this position or the assets is that $ 1 million loan is used to finance the assets and the rest 1 million is equity borrowings. So the investment of the holding company is only $ 1 million US dollars and the net assets are only worth US dollars 1 million. Now if the US dollars weakens in such a case, only the net assets value of US dollars 1 million decreases (John Y, 2010).

Currency Risk
Currency Risk

Transaction risk

Transaction risks are the most evident and talked about currency risks due to fluctuations in currency (Sebetian & Solnik, 2008). The exposure exists when the companies exporting and importing. This type of risk is of a short to medium term. If the rate of exchange during the time the company enters into contract and the time of actual receipt or payment of money changes, the amount of the home currency to be received or paid will alter and would make the future cash flows uncertain (Bartram & Bodnar, 2007).

Methods of currency risk mitigation and their shortcomings

Some of the most renowned and widely used risk mitigation strategies are those are used by companies to overcome transaction risks. Though in case of foreign currency transactions, there are chances of obtaining profit due to the increase in the rate of foreign currency (Ugur, 2012).

Non-hedging techniques and currency risk

There are two obvious risk mitigation techniques for minimizing the transaction exposure.

Transferring exposure

Under this technique, the exposure or risk of the transaction is transferred to the other company. For instance, an exporter of US selling products in Germany could quote the sale price in US dollars. In such case the transaction exposure or risk for any uncertainty in exchange rate would be faced by the German importer (Ephraim & Judge, 2008).

Netting exposure

The currency risk of transaction is minimized here by netting out. This method is of vital importance for the larger companies that are frequently involved in large amounts of currency transactions (Cavusgil, et al., 2012). Receivable of Deutsche marks of 100 million owed to some US company in 45 days is safe if the USA Company is to pay out some German suppliers Deutsche marks 75 million in about 30 days. The risk increases further if the business only has receipts on continuing basis in Deutsche marks. The risk is decreased when the receipts and payments are in various different currencies. An example has been given earlier in the exposition. Though the transaction of currency cannot be netted off fully, it may become so small that the company accepts the exposure or risks rather than incurring costs associated with hedging that are given below (Judge, 2009).

Hedging techniques for currency risk mitigation (hedging techniques or instruments)

Mitigating short term foreign exchange risks

For eliminating short term transaction exposures of currency, there are various hedging instruments available with different costs.

Forwards contracts

The most direct means to eliminate the transaction risk is by hedging the risk with forward exchange contract. For instance, suppose some USA exporter sells 50 wine cases to some Venezuelan company under sales contract, which specifies an amount of 15 million bolivars to be paid in 60 days. The exporter could eliminate the transaction exposure through the 15 million bolivars to his bank at a 60days forward exchange rate of 750 bolivars / dollar. Now it does not matter what happens to the currency rate during the next month, the company will have assurance that it will be able to convert 15 million bolivars into 20,000 US dollars (Bartram, 2008).

Now the risk or limitation with this method is that exposure could only be eliminated if Venezuelan buyer pays the obligation of 15 million bolivars. The default from the buyer would not relieve the US producer from the obligation towards the bank. Another limitation is that the forward contracts are not usually accessible for the small businesses. Banks normally quote rate that are unfavorable for the smaller businesses because the risk will be borne by the bank in case the company does not fulfill the forward contract. Creditworthy companies are also refused by banks. The non-eligible companies for forward exchange rate contracts can use the option to hedge transaction exposure through future contracts (Bartram, 2008).

Future contracts

The forward market hedge and future market hedge have many similarities. For instance, a US company has payable of $50,000 to be paid by the third Wednesday of September. This organization is able to purchase a Canadian dollar future contract for September. Now if value of Canadian dollar increases, the value of the payable of US Company will increase. However, value of the future contract will also increase by the same amount which would make the net value unchanged. Vice versa would be the case if the Canadian dollar value falls (Qing, et al., 2007).  

The future contracts are marked by the market. The losses are to be met in cash and the offsetting currency transactions would be delayed till the transaction takes place. It might also bear the risk for insolvency for the company (Hull, 2008).

Hedging through the money market

Where future market hedge is expensive, not available, or bears large risk of insolvency, a company can use the money market hedge. Suppose a US exporter is to receive 4 million Brazilian reals in in one month time. The exposure or risk of currency fluctuation could be eliminated here through borrowing Brazilian reals at a 10 percent interest rate per month. The business can them convert them into US dollars at spot rate. When Brazilian customer after one month pays of the 4 million reals, they are utilize the settle the principle and interest on the loan.

Companies should pay out more for borrowing the funds than they could receive when they lend the funds. The interest rates charged by banks rises with risk and the requirement of collateral securities or pledge are also in place. In the situation in which the business borrows future payable, it could pledge reals deposit as the collateral security. The company’s and borrowing rate would be almost risk free when the bank has low risk. In such a case, money market hedge will be normally the least expensive option even if forwards and future contracts are available (Maurer & Valiani, 2007).

Cross hedging

Cross hedging is another hedging method which is of importance for countries where options such as future contracts, forward rates, options or credits in the foreign currency are not available (Madura, 2012). It is a hedge that is established in currency which is related to value of currency in which the payable or receivable is denominated. In some of the cases, finding currencies that are correlated is easy because many small countries try pegging their currencies with major currencies like Euro, Dollar, or franc. However, there might not be perfect correlation among these currencies as efforts for pegging the values fail frequently (Lane & Shambaugh, 2010).

Now for instance, if there is a company that has receivables or payables denominated in the currency of some small nation that has no developed credit market or currency. In such case, it will explore possibility that the currency might be pegged to some major currency value. If not, then the company would observe the previous changes in value of that currency to determine whether such currency in correlated with the changes in value of some major currency. The company then undertakes a futures market, forward market, options or money market hedge in that major currency (Chue & Cook, 2008). A limitation with this method is that its success depends change in major currency value corresponds with the currency of the smaller country (Calamos, 2011).

For now, there is an only limited market for the currency futures options that features maturities greater than 1 year. Only a few banks render foreign exchange contracts of long term with maturities such as seven years. Only the credit worthy and the large corporations qualify for those contracts (Hull, 2008).

Back to back loans

Back to back loan arrangements are a method to reduce currency risks in long term transactions. For instance, where a company enters into a project with some company in another country, it can use parallel or back to back loan arrangements for reducing risk. Here the company will lend loan in its homeland currency to the other company if the other intends to invest in that country. Similarly the other company with whom the lending company is making investment will arrange loan in its own homeland currency for the investing company. Thus they will pay each other from the earnings they derive from their respective investments in the form of currencies of their respective countries. In such case both companies will be under bilateral arrangement which will be outside the scope of foreign exchange markets. Ultimately neither of them would be affected by fluctuations in exchange rate.

However the risk of default from either company always remains and they are not freed from their loan liabilities (Patnaik & Shah, 2010).

There are various other methods that are used for mitigating currency risks, but they vary from country to country and have their own limitations in general and in the context of specific countries.

Conclusion and recommendations

Effective legal drafting could be used to minimize substantial international transaction risk. The risk of currency fluctuation exposure could be eliminated or mitigated using the instruments or methods that have been described in this exposition. Though many of the instruments do not hedge the transaction exposure entirely, but they are more accessible for the medium and small size firms and the individuals. Though the instruments and methods increase transaction cost, but still businesses intend to minimize risks as a priority.

Individuals and companies should have an understanding of the transactions they do in terms of the risks associated with them. Similarly they should have an understanding of their financial and money market so that they can determine the risk mitigation instruments and techniques in those markets. In case the risk is higher, then the cost of mitigation techniques should never be avoided. They should have an eye on both the present and future currency risk of a transaction.

Bibliography

Alastair, G., 2013. Introduction to currency risk. New York: Rutledge.

Bartram, S. M., 2008. What lies beneath: foreign exchange rate exposure, hedging and cash flows. Journal of Banking & Finance, 32(8), pp. 1508-1521`.

Bartram, S. M. & Bodnar, G. M., 2007. The exchange rate exposure puzzle. Managerial Finance, 33(9), pp. 642-666.

Calamos, N. P., 2011. Convertible arbitrage: insights and techniques for successful hedging. London: John Wiley & Sons.

Cavusgil, S. T., Knight, G. & Reisenberger, J. R., 2012. International business. New Jersey: Pearson Education.

Chue, T. K. & Cook, D., 2008. Emerging market exchange rate exposure. Journal of Banking and Finance, 32(7), pp. 1349-1362.

Clark, E. & Ghosh, D. K., 2004. Arbitrage, hedging and speculation: the foreign exchange market. New York: Greenwood Publishing Group.

Coyle, B., 2001. Foreign exchange markets. Chicago: Taylor & Francis.

Ephraim, C. & Judge, A., 2008. The determinants of foreign currency hedging: does foreign currency debt induce a bias? European Financial Management, 14(3), pp. 445-469.

Graham, A., 2014. Hedging currency exposure. New York: Routledge.

Hakala, J. & Wystup, U., 2002. Foreign exchange risk: models, instruments and strategies. London: Risk Books.

Homaifar, G., 2004. Managing global financial and foreign exchange rate risk. New York: John Wiley & Sons.

Horcer, k. A., 2011. Essentials of financial risk management. Hoboken: John Wiley & Sons.

Hull, J. C., 2008. Fundamentals of futures and options markets and derivate. 6th ed. s.l.:Prentice Hall.

John Y, C. M. S.-D. V. L. M., 2010. Global currency hedging. The Journal of Finance, 65(1), pp. 87-121.

Judge, A. E. C., 2009. Foreign currency derivatives versus foreign currency debt and the hedging premium. European Financial Management, 15(3), pp. 606-642.

Lane, P. R. & Shambaugh, J. C., 2010. Financial exchange rates and international currency risk exposures. The American Economic Review, pp. 518-540.

Madura, J., 2012. International financial management. Singapore: Cengage Learning.

Matsukawa, T. & Habeck, O., 2007. Review of risk mitigation instruments for infrastructure financing and recent trends and developments. Washington: World bank Publications.

Maurer, R. & Valiani, S., 2007. Hedging the exchange rate risk in international portfolio diversification: currency forwards versus currency risk options. Managerial Finance, 33(9), pp. 667-692.

MOguillansky, G., 2003. Corporate currency risk management and exchange rate volatility in Latin America. Santiago: United Nations Publications.

Patnaik, l. & Shah, A., 2010. Does the currency risk shape unhedged currency exposure?. Journal of International Money and Finance , 29(5), pp. 760-769.

Plaza, D., 2011. The role of currency risk futures in risk management. Norderstedt: GRIN Verlag.

Poghosyan, T., 2010. Determinants of foreign exchange risk premium in the Gulg cooperation council countries. Washington: International Monetary Fund.

Qing, D., Dong, L. & Kouvelis, P., 2007. On the integration of production and financial hedging techniques in global markets. Operations Research, 55(3), pp. 470-489.

Rose, P. S. & Marquis, M. H. L. J., 2008. Money and capital markets. London: McGraw-Hill/Irwin .

Sebetian, M. & Solnik, B., 2008. Applying regret theory to investment choices: currency hedging decisions. Journal of International Money and Finance, 27(5), pp. 677-694.

Stephen, B., 2003. Managing currency exposure. CFA Magazine, 14(4), pp. 50-51.

Stephens, J. J., 2003. Managing currency risk: using financial derivatives. John Wiley & sons.

Ugur, L., 2012. Currency hedging and corporate governance: a cross country analysis. Journal of Corporate Finance, 18(2), pp. 221-237.

Currency Risk Relevant Blog Posts

Currency Crisis Dissertation

View Finance Dissertation Topics Here

IFRS IASB Frameworks

Finance Assignment – Various normative theories, measurement issues under IFRS and Conceptual framework

IFRS IASB Frameworks – This report basically provides an analysis of different financial accounting measurement techniques, their advantages and disadvantages and practical implications. Accounting measurement has become a controversial issue due to its assorted nature in financial reporting system. The conceptual framework developed by both systems is unable to provide accurate cost of assets and liabilities at the end of financial year.

There is a misunderstanding behind the rationale that whether measurement is a set of calculation or numbers but it provides no as such vivid explanations and is totally cognitive based. A lot of research work and publications have been made about this topic but the matter is still under consideration. Financial reporting measurement is a debatable issue and still under consideration.

Most of the literature has been published on the issue of historical cost and value accounting. It shows that it is never ending issue. Historical cost measurements narrates that total assets and total liabilities should be recorded and reported at the procured price while current cost accounting states that assets and liabilities should be recorded and reported at existing market value.

Role of IASB & FASB frameworks

International Accounting Standard Board Framework

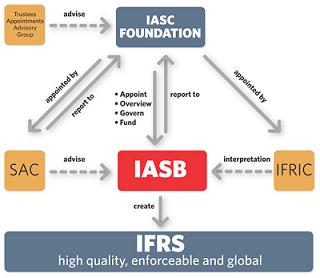
International Financial Reporting Standards (IFRS) are based on the IASB framework developed for the sake of preparation and presentation of financial statement.

Financial Accounting Standard Board Framework

FASB is U.S primary body for the development of accounting standards. It issues new rules so called Statement of Financial Accounting Standards (SFAS) based upon FASB which are basically derived from Generally Accepted Accounting Principles (GAAP).

IASB and FASB frameworks present a facility of persistent and logical formulation of IFRSs and SFAS respectively. Both of these also aim to provide its users with a platform to resolve various complex accounting issues. Hence, framework has the benefit being the status of conceptual base for development of IFRSs.

The IASB issues IFRS to more than hundred countries which also include European Union but it excludes United States. There is a strong co-relation among both IASB and FASB standards. It is probable that U.S will also move to IFRS in 2016. Despite of all this, both IASB and FASB sat together to reach at a final conclusion about this matter but still there is a room for improvement.

Mary E. Barth has concluded that Fair value measurement provides somewhat precise and specific value of both assets and liabilities. The core objective of this report is to determine why other frameworks lack behind. (Mary E. Barth, 2013, pp 2-3)

Comparison of various cost approaches

There are many cost measurement techniques which are used to record assets and liabilities in financial statements; some of these are as follows:

Unmodified historical cost

This type of cost includes those amounts which were paid at the time of procurement of assets no matter whatsoever the life of asset is. It is totally inadequate way of recording measurement.

Modified historical cost

This cost is modified due to various factors like impairments, amortization due to depreciation or appreciation of asset with the passage of time. It seems to be relatively more valid type of measurements.

Fair value measurement

It is a net price which can be received while selling an asset or paying any liability in a logical transaction among market participants at the measurement time frame.

These are frequently used in financial reporting and possess different characteristics. Only one of these techniques is used to record assets and liabilities in common practice so as to draw conclusion based upon performance. Financial statements are comprised of total assets (both current and fixed), total liabilities (both current and long term) and owner’s equity. The framework indicates that equity is the difference between the assets and liabilities after proper measurements. (Mary E. Barth, 2013)

IFRS IASB Frameworks – A Critical Analysis

The aggregation is a qualitative attribute which slightly affects the quantity. Hence, a minor change in assets and liabilities generally affects net income and expense. However, the Framework does not elucidate the factors behind balancing effects on Statement of Financial Position (SOFP) and Comprehensive Income.

Fair value provide more effective results as compared to un modified and modified costs in case of single assets and liabilities as it contains both qualitative and take into account assets and liabilities. Whereas unmodified cost is totally irrelevant and invalid. Modified cost if not supported with accounting standards cannot be explained in a scenario.

Fair value determination is only more reliable and accurate if it is acquired faithfully with an ethical mentality. Still there is an ambiguity whether modified historical cost is more appropriate than fair value determination. Hence we may conclude that fair value and unmodified costs are set according to a specific economic objective while modified is an accounting calculative work.

Despite of all these measurement techniques, only one selected technique should be used for estimation so as to achieve significant accounting results. Anyhow, other technique can be used where direct measurement is impossible for estimation. This approach will be helpful to maintain consistency, comparability and significant aggregation of accounting data. . (Mary E. Barth, 2013, pp 19-20)

IASB recommended approach

IASB also endeavours to find a single measurement technique in its own projects. IASB also favours fair value measurement that it provides more effective results, though it sometimes fails to assess the cost of any asset. Practically, all the framework of accounting regulations except IFRS is not using single approach of measurement.

For instance, measurement of cost to predict operating cash flows will provide major share of turnover in going concern business approach, while fair value would be more appropriate, relevant and reliable for the valuation of marketable securities and investments. However if you use different approaches in each financial year, the descriptive authority of such aggregation would be more poor and risky.

Preliminary and Subsequent measurements

However, measurement approaches can be distinguished according to preliminary and subsequently with respect to nature of the measurement subject matter. For example, in case of going concern business, long term assets meets the pre-requisites while current liquid assets (inventories) and marketable securities are measured differently. However, it all depends upon standard setters that which measurement technique should be selected.

All the regulations of Accounting including IASB, FASB, UK Accounting Standards Board and Australian Standard Boards possess a common thing that financial statements are primarily developed to help its stake holders (external and internal users) so that they may analyze the organization. Investors can depict growth rate, market value and share value (Jiri Strouhal, 2014).

IFRS IASB Frameworks

Effects of choosing wrong measurement approach

Determining right choice of measurement is very important for organizations. There are five different approaches like as fair value treatment of costs, historical cost accounting, modified historical cost accounting, current purchasing power accounting, current cost accounting and continuously contemporary accounting. All these techniques have various pros and cons. But fair value treatment of costs is mostly used and reliable approach to recognize costs. Accountant should be prudent while choosing cost approach.

Wrong choice of cost approach may adversely affects the financial statements, shareholders image towards firm’s assets and liabilities. Historical cost accounting deals with recording assets on purchased price which is wrong measurement. If any asset is to be sold, then we need to consider again choose either fair value approach or modified historical cost accounting as a measurement rather than historical cost accounting value. This type of costing is only helpful for long term basis if re-procurement of machine or asset is to be needed.

Current purchasing power accounting measurement shows the impact of inflation on the net value of money. To achieve CPP, firstly historical costs are changed into current prices with the help of consumer price index (CPI). But Price indexes quality includes simply averages and perhaps not matches with expenses incurred by even a single shareholder. It sometimes becomes ridiculous that if re-stated asset values considered everything while the changed amount is neither paid nor is asset value increased. Current cost accounting despite of its importance is not reliable for long term basis. Then we move to historical cost accounting for decision making.

International Accounting Standards

Some of the most important International Accounting Standards have been explained below to elucidate the effect of measurement and reporting accounting on current assets and liabilities.

Fair value measurement (IFRS-13)

Fair value measurements are mostly used and reporting standard. IASB, FASB, AASB lays stress to use this standard but each one provide their own standard guidelines for the determination of fair value. IFRS-13 also tells how preliminary fair value is to be measured and how successive fair value is found.

Fair value: It is an amount which can be gained when an asset is sold or a liability is transferred among market participants in normal transactions at measurement date. Market participant are usually those buyers which have economic and ethical rationale.

Fair values should be gained from principal market as it is pure competitive market and possess large volume of desired nature. If it is unavailable, then accountant should concern from advantageous market. Final fair value must contain location of asset and its condition

Assumptions

  • Transaction cost should be ignored
  • Transportation cost should be incorporated
  • In case of most advantageous market, both transaction and transportation costs should be incorporated

Inventories (IAS-2)

This standard has been developed to assist and provide a valuable accounting treatment for physical inventory which is a current asset. This treats cost of the inventory like an asset which can be easily carry forward unless it is sold. The standard also aimed to provide assistance to recognize and determine the costs along with net realizable value.

Scope

This standard is valid for all inventories excluding:

  1. It is not valid for construction contracts specially treatment of work in progress
  2. Financial instruments including marketable securities
  3. Natural assets or biological assets

Measurement of inventories

Inventories must be recorded at the lesser cost and net realizable value (NRV).

Cost of Inventory

Inventory cost includes cost of purchase, conversion cost (Labour and Production overhead) and the cost freight charges incurred to bring an asset from vendor place to factory.

Cost of purchase

This cost is comprised of purchase price, transportation charges, import duties, taxation other costs incurred to attain asset and trade discount and other discounts are deducted from original cost of purchase.

Cost formulas

Inventory once purchased can be calculated by using first in first method (FIFO) and weighted average cost method while last in first out (LIFO) is not allowed.

Cost of the inventory can be calculated through FIFO and Weighted Average Cost Method. However, LIFO method is not permitted.

Record of reversing (Expense)

Reversal of note down of equivalent inventory might be prepared up to the cost.

Events after reporting period (IAS-10)

IAS-10 tells the treatment for those events which occurs after the financial period. So, adjustments are to be made in financial statements. Management will provide final approval of accounts on 31st Mar, 2014 while final accounts will be forwarded to annual general meeting (AGM) to get approval for shareholders on 30th Apr, 2014. After this, reports will be authorized for issuance.

IAS-10 is appropriate for those events which are took place after the balance sheet date but to the date of authorization by the management i.e. 31st Dec, 2012 to 31st Mar, 2013. Event can be adjusting or non-adjusting.

Adjusting Events

Those events which present supplementary proof of their existence at the financial statement i.e. balance sheet are called adjusting events. Adjusting events are needed to be documented in the financial statements.

Example:

  • Errors and inaccuracies in financial statements if discovered after reporting period, their adjustments will be covered in adjusting events.
  • If a court case was settled validating the compulsions at the end of financial period.
  • If an asset was purchased earlier but cost of purchase confirmed after reporting period. 

Non Adjusting Events

Those events which doesn’t support supplementary proof of their existence at the financial statement i.e. balance sheet are called non-adjusting events. Non adjusting events are needed to be disclosed in the notes of financial statements.

Example:

  • Declaration of dividends is a non-adjusting event as these are recorded once these are proposed after reporting date.
  • Anomalous loss, natural disasters, amalgamation, renovation and acquisitions do not provide supplementary events so these are adjusting events.

Historical Cost Accounting

Historical cost is a sum of price which is paid by firm to acquire an asset for use. It includes all costs incurred to bring the asset for smooth operation. It is an ancient accounting standard which was developed with a rationale that prices are smooth and normal changes occur with a passage of time. Such conservative style of accounting doesn’t make and stipulation for change in purchasing power. There is less manipulation of mangers as it is only recorded at acquisition price every year. Accountants have to meet the expected return of its shareholders and investor despite of the net wealth of the firm. This shows that primarily focus is upon income statement which will be a vivid glance whether firm is working efficiently or not. (Jiri Strouhal, 2014).

Advantages

  • Historical cost has a substantive effect on appraisal evaluation and assortment of decision rules.
  • If management has to determine which decision would be more useful, it may get help from past performance.
  • Historical cost is directly associated with past decision. Past data is helpful to forecast for better decision making. There prime object is to determine what profit did they earn in past not what they can increase.

Disadvantages

Historical cost is inappropriate for decision making as it doesn’t follow stewardship function. Investors have more concern with up and down in their investments return rather stable return.

Modified historical cost

This historical cost is modified by inculcating various factors like impairments, amortization due to depreciation or appreciation of asset with the passage of time. It seems to be relatively more valid type of measurement. Modified cost basically provide better picture of firms assets and liabilities. In Australia, modified historical cost system is used instead of historical cost accounting. It states that assets should be recorded in balance sheet after fair value determination.

Current purchasing power accounting

It is an accounting measurement which shows the impact of inflation on the net vale of money. To achieve CPP, firstly historical costs are changed into current prices with the help of consumer price index (CPI).

This theory is basically derived from macroeconomic “inflation” perspective that persistent rise in general price level of commodities also called inflation adversely affects currency value. If pound value is decreased then it becomes difficult to compare financial statements by using this approach.

Strengths

  • CPP recognized the worth of money which should be generated and maintained in business to sustain overall shareholder’s purchasing power.
  • It is comparatively easy, cheaper and improves overall shareholders worth by eliminating inflationary elements which arise from change in currency from monetary profit.

Weaknesses

  • Price indexes quality includes simply averages and perhaps not matches with expenses incurred by even a single shareholder.
  • It sometimes becomes ridiculous that if re-stated asset values considered everything while the changed amount is never paid nor is asset value increased.

Current Cost Accounting

Assets are usually values at specific amount of cash or its equivalents if same asset is to be acquired for use in firm. Similarly, liabilities are also settled with the discounted amount of cash or its equivalents needed to reconcile the obligation presently.

Advantages

Current cost accounting use present clearer picture of an asset as compared with historical cost accounting which is helpful for decision making. Due to high degree of precariousness in business environment, financial statements should also demonstrate reality instead of past transactions. A study on New Zeland company directors by Duncan & Moorers (1988) signified that current cost accounting presents more valid and reliable information than historical cost accounting.

Disadvantages

Peasnell et. al. (1987) stated that cost accounting information is used by investors in short term assortment decision making. It also doesn’t work as a driving force for long term returns. Shareholders are more concerned with historical cost accounting to get information about investment returns.

Continuously contemporary accounting

This famous accounting theory commonly known as CocoA was given by an Australian Raymond Chambers. The purchasing primacy of money is highly volatile or current and is subject to change with the passage of time. This model basically tells that the current worth of the business is equal to the total cash equivalents of its assets. It just like current cost accounting system measure both assets and liabilities at the existing cash price.

Strengths

The model is designed in this way that accountants can easily deploy it in developing balance sheets and financial statements. The true picture of assets and liabilities in cash price provide an assistance to firm in rapidly changing environment. CoCoA balance sheets only estimates what will be received if its assets are sold to meet short term liquidity challenge.

Weaknesses

CoCoA system requires from the management to shift from cost based system to way out price which is highly opposed by top management in many firms. The CoCoA balance sheets are mostly failing in calculating internal worth of the assets as they only focus on market prices.

Finance Accounting Dissertation Topics

Case Study (valuation of roads and highways)

Renewal accounting method basically determines the impairment of highway infrastructure and roads. Highway infrastructure is considered a single asset and many performance indicators are applied to evaluate impairment on asset. Asset valuation involves measures to calculate firm’s assets and their current value in monetary terms. Current monetary value is also evaluated by depreciated replacement cost method for highway infrastructure assets specially.

DRC = Gross Replacement Cost – Accumulated Consumption

Impairment should be calculated by a consistent approach. Once an approach is set, valuation should be prescribed. Finite life assets and components by using conventional method is valid valuation impairment approach for highway infrastructure and roads.

All the assets and components can be categorized into two types:

  • Conditions based maintenance

This identifies physical condition and performance data is also used for estimation of consumption of the asset whereas maintenance cost is also paid to make it look new.

  • Time based maintenance

This approach identifies the asset consumption by its age and condition

Modified historical cost would be more applicable for smooth reporting and recording of costs in this case. As roads and highways are long term projects and their value also changes with the passage of time.

References

  1. Mary E. Barth (2013). Measurement in Financial Reporting: The Need for Concepts. Forthcoming, Accounting Horizons 2014, 40(1) 2-20
  2. Jiri Strouhal (2014) Historical Costs or Fair Value in Accounting: Impact on Selected Financial Ratios, Journal of Economics, Business and Management 2015, 3(5)1-5
  3. IASCF Staff (2005). Measurement Bases for Financial Accounting-Measurement on Initial Recognition 70(1) 101-180
  4. International Accounting Standards Board, 2011, International Financial Reporting Standard 2 IASB, London.
  5. International Accounting Standards Board, 2011, International Financial Reporting Standard 13 Fair value measurement. IASB, London.
  6. International Accounting Standards Board, 2011, International Financial Reporting Standard 10 Events after reporting period. IASB, London.
  7. Current-purchasing-power (CPP)
  8. Continuously contemporary accounting (CCA), retrieved Dec, 2014
  9. Guidance Document for Highway Infrastructure Asset Valuation taken

Click Here To View Finance Dissertation Topics

Financial Reporting Ratio Analysis

Financial Reporting and Ratio Analysis Essay

Ratio Analysis – Part One

Ratio Analysis And Financial Reporting – According to IAS 7 net cash flow from operating activities can be calculated using either of two methods; direct method and indirect method. The direct method shows operating cash receipts and operating cash payments; including cash receipts from customers, cash payments to and on behalf of employees, cash payments to suppliers; all resulting in the net cash flow from operating activities. The indirect method begins with profit before tax and adjusts for non-cash charges and credits such as depreciation and for the movement in working capital items.

In simpler terms, the direct method looks at all actual cash transactions, while with the indirect method you look at the balance sheet items in relation to the previous year to find the cash inflow and outflows from operating activities while adjusting for non-cash charges and credits such as depreciation and goodwill revaluation rather than look at specific transactions.

The main advantage of the direct method is that it shows the operating cash receipts and payments, this specific knowledge of the sources of these cash receipts and for what purposes cash payments were made is especially useful when trying to forecast future cash flows. The preference of IAS 7 is that the direct method be used but does not require it. The main benefit of the indirect method is that it shows the difference between reported profits and net cash flow from operating profits.

There are differing views among national standard setters as well as within the business community. The main issue of disagreement being whether in all cases the benefit to the user outweighed the costs to the company of providing this type of reporting. The ASB in the UK has generally held the indirect method to be preferable, and has only encouraged the use of the direct method when the possible benefit of the users outweighs the cost of providing it in the new revised version of FRS 1.

This is different to the general view of the IASC as well as the FASB in the USA who hold the view that the direct method is preferable. I’m of the opinion that this difference will result in companies giving greater consideration to which method suits them best considering the relevant costs rather than just relying on the advice of a particular standards board; which I think is a positive effect.

David Alexander and Simon Archer the authors of National Accounting/financial reporting standards guide 2013 are of the view that this issue should be viewed from the perspective of the user rather than the prepared and therefore the most beneficial method is the direct method. In an article released by the Institute of Certified Public Accountants in Ireland (CPA) discussing international standards, the CPA expressed the view that most Irish companies are unlikely to adopt the direct method as it requires the segregation of VAT from cash receipts and payments during the year. This is likely to be expensive due to system changes as the accounting programmes are designed to identify VAT at the point of sale or purchase, rather than at the point of cash receipts or payments.

Cash From Operating Activity
2013
£0
Cash received from customers (W1) 30071
Cash paid to suppliers and employees (W2) -18886
Other cash operating expenses (W3) -6033
cash generated from the operations 5152
interest paid -126
tax paid -823
Net cash from operating activities 4203
proceeds on disposal of property, plant & equipment 3
interest received 8
acquisition of property, plant & equipment -2641
Net cash used in investing activities -2630
proceeds from the issuing of share capital 0
repayment of borrowings -400
payment of finance lease liabilities 0
dividends paid -1634
Net cash used in financing activities -2034
Net (decrease)/increase in cash and cash equivalents -897
cash and cash equivalents at 1 January 432
Effect of exchange rate fluctuations on cash held 136
Cash and cash equivalents at 31 December -329
**workings are included in the appendix

Below I would like to provide a summary of Zotefoams Plc.s financial position and operating performance and in doing so analyse the liquidity, profitability, efficiency and gearing of the company.

From looking at the five year trading report it is clear to see that Zotefoams Plc has managed to steadily increase turnover from £25.2m in 2011 to £30.1m in 2013 that is an increase of £4.9m which is a 16.27% over two years. Also operating profit (excluding exceptional items) has increased from £1.6m in 2011 to £2.8m in 2013; that is an increase of £1.2m or 42.86% rise over two years. Furthermore, earnings per share (excluding exception items) has risen from 3.2 in 2011 to 5.4 in 2013, that is an increase of 2.2 which is a rise of 41% over two years.

In this discussion I have only considered figures excluding the impact of exceptional items as I believe these figures give a clearer view of its true performance and help forecast for the future more accurately, this is a company that is still at a very early stage of its development and hence is likely to have exceptional items more often now than in the future. A figure that should be taken in to consideration is the profit after tax, in 2011 it was £1.2m, in 2012 it was £2.4m, and then £1.2m in 2013, this does not shown a pattern of a down turn as the great increase in 2012 was caused by an exceptional item, this can be further understood by looking at the profit before tax (excluding exceptional items) whish was £1.3m in 2011, then £1.8m in 2012 and finally £2.7m in 2013; this clearly shows a pattern of strong growth over the last three years. Below, I have done ratio analysis in the areas of liquidity, profitability, efficiency and gearing to illustrate better the company’s performance in these areas.

Profitability Ratios

Return on Capital Employed (ROCE)

Year Result
2012 9.52%
2013 5.41%

ROCE shows the company’s net profit before interest and tax in relation to total capital invested as a percentage. Generally a decrease in the ROCE percentage from one year to the next could signify various internal or external factors affecting their business, externally a more difficult economic climate for the company which could be caused by a general down turn in the industry or fierce competition, internally it is usually due to poor utilization of its total assets by those entrusted to run the company, either way it is the duty of the management to utilize the assets of the company to gain maximum profits.

The ROCE has decreased from 9.52% in 2012 to 5.41% in 2013, this is a very major decrease, this would normally lead one to think that the management have severely underutilized the assets of the company showing a poor performance on their part, but on closer inspection it is clear that the results have been skewed as the 9.52% figure for 2012 is largely inflated, as the PBIT of £3.472m was inflated by £1.499m of exceptional items (reduction in administration costs) in the profit calculation, and a decrease in profits in 2013 of £1.074m due to exceptional items (increase in administration costs), had these exceptional items not been considered in calculating the ROCE it would have shown a strong increase between 2012 and 2013.

Gross Profit Margin Ratio

Year Result
2012 22.65%
2013 25.94%

Ratio analysis – The gross profit margin ratio shows the gross profit as a percentage of its sales revenue. This shows that it has increased from 22.65% to 25.94%, this is a positive increase of 3.29% from 2012 to 2013.

Net Profit Margin Ratio

Year Result
2012 11.75%
2013 5.32%

The net profit margin shows the net profit before tax as a percentage of its sales revenue. It has decreased from 11.75% in 2012 to 5.32% in 2013; that is a decrease of 6.43%. This would normally be a serious issue to consider, but as explained previously the results have been skewed due to negative exceptional items in 2013 and positive exceptional items in 2012, had these items not been considered in this calculation it would have shown a positive increase.

Liquidity Ratios

Current Ratio

Year Result
2012 2.412949
2013 2.1780673

The current ratio is one of the best measures of liquidity. It is generally accepted that a ratio of 2:1 is a strong position to be able to meet the company’s short term liability responsibilities; the higher the ratio is; the more liquidity the company has, making it more likely to be able to cover its short term liabilities. Although it has decreased from 2.41:1 in 2012 to 2.18:1 in 2013, it is still over the accepted 2:1 ratio, therefore there is no reason for investors or the company to fear liquidity problems.

Quick Asset Ratio

Year Result
2012 1.51
2013 1.36

Conventional it is held; the most ideal quick assets ratio equals 1. In 2013 and 2012 the quick asset ratio was comfortably over 1, although it has decreased to some extent. It is not good to have too high a current ratio analysis or quick assets ratio, as this would signify the under-utilization of the company assets.

Efficiency Ratios

Debtors Collection Period (DCP)

Year Result
2012 80.658803
2013 74.853421

The debtors’ collection period ratio analysis shows the average amount of time taken to collect debts from credit sales. In 2012 it is at 80.7 days which has decreased to 74.9 days in 2013, these positive results show that the DCP has significantly decreased from the previous year signifying an improvement in efficiency, this supports the view that its credit control system has functioned more efficiently.

Stock Holding Period (SHP)

Year Result
2012 66.337569
2013 62.071483

The stock holding period ratio analysis shows the average amount of time stock is held before being sold, it has decreased from 66.3 days in 2012 to 62.1 days in 2013, again it shows a improvement in efficiency showing that the company’s stock control systems are running more efficiently than the previous year.

Gearing Ratio

Year Result
2012 35.32%
2013 31.02%

Gearing is calculated to show what proportion of a company’s total capital is provided by loans capital as opposed to equity. The greater the proportion of total capital is provided by loans the greater the vulnerability to a down turn in profits.  This is because the interest on a loan must be paid regardless of the company making a profit.

33.3% gearing is conventionally accepted as medium/high gearing, although this does vary from industry to industry. The gearing ratio of 35.32% in 2012 is not considerably high, this has decreased to 31.02% for 2013; it has been brought down firmly in to the area conventionally accepted as medium gearing thus decreasing the company’s gearing vulnerability to a down turn in profits meaning it is not considered to be a high risk investment.

Ratio Analysis – Part Two

Ratio analysis in the areas of liquidity, profitability, efficiency and gearing are very important when trying to understand the financial position of a company, all of the data required for calculating these ratios are taken from the balance sheet and income statement.

The balance sheet statement summarizes the value of total assets and liabilities, as well as owners’ equity at a specific date. The balance sheet gives the user a good understanding of the company’s value as you can see what it owns and owes. The balance only provides a snapshot of this information on the date of reporting as the items in the balance sheet could change the next day, furthermore the balance sheet can be manipulated in various ways such as incorrectly valuing assets such as work in progress inventory or incorrectly valuing buildings, plant and machinery.

It is not straight forward how all items in a balance sheet are calculated. There are many ways that firms try to hide debt by not recording it on the balance sheet such as the well documented case of Enron who were keeping debts off the balance sheet by offloading the debt to special purpose entities (SPEs). It is important to any investor to know that the company they are buying a share into actually owns tangible assets (less liability) that back up the value of the company’s shares; this reduces the risk of the investment.

Beyond risk to investment capital; the investor will look at profitability as this is the objective behind making an investment, for this purpose the income statement is very useful; as it shows net profit for the previous year as well as a breakdown of how this was calculated including figures for revenue, cost of sales and expenses etc.

Analysis of previous income statements and the five year trading summary will help the user to get a good understanding of how well the company has been performing in the past. The income statement can also be manipulated, such as the abuse of one time charges in the income statement when the usage of one time charges is misused to result in reported profits being lower than expected in one year, and then be seen to dramatically increase the next year, resulting in share prices rising allowing managers and related individuals to cash in on shares purchased at a lower price the previous year.

The cash flow statement shows all cash and cash equivalents entering and leaving the company for the reporting period. It allows investors to see how money is being spent and where it is coming from. It is generally held to be one of the more reliable financial statements as it is less open to manipulation as it deals with simpler and clearly tangible accounting items. Given this there are still ways to manipulate it such as dishonesty in accounts payable by counting cheques in the mail as cash in hand rather than money paid out or the choice of making payments late on purpose.

Efforts have been made by the introduction of further legislation and tightening of regulatory frameworks as well as implementation of further standards; such as international auditing standards (IASs); to counter act these problems namely the Sarbanes Oxley act 2002 in the USA and similar provisions in the UK.

By providing all three financial statements the user will be able to gain a good understanding of the company’s financial position and profitability; each of them provides different useful information. Furthermore it is more difficult to manipulate one financial statement and not result in contradictions with the others. The cash flow statement helps to back up the balance sheet and income statement. Reporting based on international reporting standards are very important, as it means that prepares of reports must treat accounting items as set out by international standards leading to more reliable and comparable financial statements for the user.

Due to international auditing standards one would expect that auditors will find the cases where manipulation and fraud has taken place; which gives the investor more confidence in the financial statements that he must rely upon to make decisions. I would still advise any potential adviser to fully read all reports and notes beyond just the three financial statements.

In this section I will discuss how Zotefoams Plc provides segmented information under IAS 14 and how this will change upon the adoption of IFRS 8 as well as consider the relevance of this information to the company’s current and potential investors.

I would like to begin by explaining IAS 14 and segment reporting. Companies often carry on several types of business or operate in many different geographical locations, with varying opportunities of growth at different levels of risk relative to the geographical location or type of business. It is very difficult for a reader of financial reports to make judgement about the nature of different activities carried out by a company or what impact each activity has on the financial situation of a company unless some segmented analysis of the financial statements are provided.

Segmented reporting is required to help the users of financial statement to more thoroughly understand the past activities of the company and thus make a more informed assessment of the company’s future prospects; as well as be aware what impact will occur on the company if there are significant changes in components of the company. All of this helps to assess better the risks and potential returns for the investor.

IAS 14 was set out to standardize segmented financial reporting by companies. IAS 14 only applies to publicly quoted companies or those that are about to be. Zotefoams Plc is a publicly quoted company and therefore should comply with the provisions of IAS 14. IAS 14 does encourage non-publicly quoted companies to report segmented information, and if they do they should comply with its provisions.

According to IAS 14 a company should report on business and geographical segments showing the groupings of products and services provided by each company segment as well as the composition of the geographical segments. One type of segmentation can be deemed as primary; chosen from either business or geographical, the second should be regarded as secondary. This is usually decided based on the company’s internal management and organisational structures as well as the internal financial reporting system for management. Geographical or business segments can be judged to be reportable when the majority of its sales revenue is gained through sales to customers who are external, plus also:

  • The revenue is 10% or above of total revenue of total segments
  • Its profit or loss is 10% or more of the combined total of profits or losses
  • It assets are 19% or above of total assets of the company (combined total of all segments)

Other segments should be reported if the total external revenue from segments that have been deemed reportable does not reach 75% of total company revenue; more segments should be recognized until 75% of the total consolidated revenue is shown as reportable segments. The following is to be disclosed for each primary reportable segment:

  • Revenue, sales to external customers and inter-segment sales disclosed separately, the basis of price setting should be disclosed for inter-segment sales.
  • Profits before interest and tax for continuing operations and discontinuing operations should be disclosed separately
  • Carrying amount of segment assets
  • Segment liabilities
  • Cost applicable to the period for acquiring  property, plant and equipment as well as intangibles;
  • Depreciation and amortization charges, as well as other significant non-cash expenses or otherwise cash flows from operating, investing and financial activities in line with IAS 7 cash flow statements.

Each secondary segment should disclose:

  • Revenue, disclosing separately how much is external sales and how much to other segments
  • Segment assets total
  • Cost applicable to reporting period for purchasing  property, plant and equipment as well as intangibles

Zotefoams primary segment reporting is reported by business area, the company sells two main types of foam which are Polyolefin and HPP. All of the above disclosures listed above for the primary reportable segment are made in the annual report. Furthermore, the revenue from external customers, segment assets; as well as capital expenditure (on property, plant and equipment as well as intangibles) are reported in the annual report for the secondary segment report which is done by geographical location which is separated in to: UK, Europe, North America and the rest of the world.

All segment reporting is in accordance with IAS 14. HPP is a new product, it can be seen that the HPP segment is making a loss, this is expected as R&D is likely to cause expense to outstrip revenue at such an early stage, you can see from the segment report that the Polyolefin segment is making strong profits, this would not have been clear if segmental reporting was not provided.

I will try to only discuss the differences between IAS 14 and IFRS 8 that are relevant to Zoatfoams plc. IFRS 8 has affected three main areas of segment reporting, they are; the identification of segments, the measurement of segment information and disclosure.

In terms of identification of segments; IFRS 8 states that segments that sell primarily or exclusively to other operating segments of the company can still be deemed an operating segment if it is operated that way. This is different to IAS 14 which reduced reportable segments to be segments which gain most of their sales revenue from customers who are external, IAS 14 doesn’t oblige that the separate levels of a vertically-integrated company be deemed to be separate entities.

I do not believe this will have much effect on Zotefoams Plc as they do not do any inter-segment trade, nor could it be said that from their company structure that it is a vertically-integrated company with separate entities in such a vertical chain to be deemed as separate operating activities.

IFRS 8 requires that the information reported on each segment should be the same information that is provided to the chief decision maker for the activity of allocating resources to that segment and assessing its performance. This may mean for Zotefoams Plc that they may be required to provide more segmental information depending on their internal reporting practices.

Ratio analysis – A major difference between IFRS 8 and IAS 14 is that IFRS 8 requires an explanation of how profit or loss, assets and liabilities are measured for each operating segment, rather than define revenue, expense, result, assets and liabilities for each operating segment. This results in companies having more control over what is included in segment profit and loss in line with their own internal reporting practices. As companies are given greater choice over disclosure this could put investors at greater risk as there will be more room for manipulation of information.

Interest revenue and interest expense must be reported for each of the reportable segments separately if they are used to calculate segment profit or loss unless the majority of the segments revenue is earned by interest resulting in the chief operating decision maker making decisions to allocate resources or judging the performance of the segment based on information mainly on interest revenue.

The aim behind revising IAS 1 was to make it easier for users to be able to understand and compare financial statements and forms of key ratio analysis. Financial information that goes in to financial statements are to be aggregated on the basis of shared characteristics, as well as introducing a statement of comprehensive income. This is being done so that it is more visible to see the impact on the company’s equity resulting from transactions between the company and its owners in that capacity; such as share repurchases, separately from the impact caused by transactions between the company and non-owners such as third parties.

Comprehensive income can be displayed in either a single statement or be separated in to two statements including a income statement and a statement of comprehensive income statement. The ICAEW as well as the ACCA have both disagreed on giving the choice between the two as they believe it will lead to confusion amongst users making comparability more difficult. The ACCA also disagrees with the decision to change the name of the balance sheet to statement of financial position on the grounds that the definition of the balance sheet is well known; they feel this change will only result in more confusion especially when preparers are not obliged to use the new title which will result in some prepares taking it up and others not; making comparison more confusing for users.

The ACCA are also of the view that the decision to include a statement of financial position at the beginning of the reporting period is not needed and will again lead to further confusion; this information if needed could easily be looked up in the previous year’s report.

These changes are not likely to have a major impact on Zotefoams other than the effort required to make these new changes, as the changes have not been made to change how accounting items are treated but rather the changes have just been put in place to affect how some information is displayed as the change in name of the balance sheet, the choice in display of comprehensive income statements and the inclusion of the balance sheet from the beginning of the reporting period, these changes just provide the information to users in a way that it is easier for them to understand the financial position of the company. In the 2013 report a statement of recognized income and expense (SoRIE) was included, by 2009 when the IAS 1 revisions must be implemented; the annual report will have to include a statement of changes in equity in an addition to the SoRIE or choose to combine them into a single statement. This additional information already exists in the annual report in the notes section.

Ratio Analysis
Ratio Analysis

References

ACCA 2.5 Financial Reporting (international stream) Study Text (2012), FTC – Ratio Analysis

David Alexander and Simon Archer, Miller International Accounting/Financial Reporting Standards Guide (2013), CCH

Barry Elliott and Jamie Elliott, Financial Accounting and Reporting: 11th Edition (2013), Financial Times/ Prentice Hall

Company Law, Jerry DeFreitas, 5th edition (2013), Castlevale Handbooks

Zotefoams Plc, Annual report (2013) Technical summary: IAS 7 Cash flow statements Deloitte, IAS Plus, (December 2013)

IASB, press release, (6 September 2013)

Appendix

Ratio Analysis

1. Profitability Ratio
a) Return on capital employed
ROCE= PBIT *100%
Equity+   Long Term Loans
Year Workings RESULT
2012 3472/(25622+9050)*100% 9.52%
2013 1762/(24838+7704)*100% 5.41%
b) Gross profit margin
GP   MARGIN= Gross   profit *100%
Sales   revenue
Year Workings RESULT
2012 6335/27975*100% 22.65%
2013 7795/30052*100% 25.94%
c) Net profit margin
NP MARGIN= PBT *100%
Sales revenue
Year Workings RESULT
2012 3288/27975*100% 11.75%
2013 1599/30052*100% 5.32%
2. Liquidity Ratio
a) Current ratio
Current ratio= Current   assets
Current   liabilities
Year Workings RESULT
2012 10547/4371 2.412949
2013 10030/4605 2.1780673
b) Quick assets ratio
 Quick assets ratio= Current assets less stocks
Current liabilities
Year Workings RESULT
2012 (10547-3933)/4371 1.51
2013 (10030-3785)/4605 1.36
3. Efficiency Ratio
a) Debtor collection period
 DCP= Average trade debtors *365
Credit sales
Year Workings RESULT
2012 6182/27975*365 80.658803
2013 6163/30052*365 74.853421
b) Stock holding period
 SHP= Average stock *365
Cost of sales
Year Workings RESULT
2012 3933/21640*365 66.337569
2013 3785/22257*365 62.071483
4. Gearing Ratio
 Gearing= Total liability-Current liability *100%
Capital employed
Year Workings RESULT
2012 (13421-4371)/25622 35.32%
2013 (12309-4605)/24838 31.02%
 Cash from operating activities
(W1) Cash received from customers £000 £000
opening trade receivables 6182
SALES 30052
36234
less closing trade receivables -6163
cash receipts 30071
(W2) Cash paid to supplier and   employees £000 £000
opening trade payables -3273
Purchases:
cost of sales 22257
closing inventory 3785
less opening inventory -3933 22109
less closing trade payables 3487
less depreciation 3437
net cash paid to suppliers and employees 18886
(W3) Other cash operating expenses
Distribution cost 2117
Administration expense 3916
6033
Notes: All figures for workings are taken from the
balance sheet, income statement and cash flow statement

Did you find any useful knowledge relating to Financial Reporting and Ratio Analysis in this post? What are the key facts that grabbed your attention? Let us know in the comments. Thank you.

Ratio Analysis Relevant Posts

Project Management Constraints

View Finance Dissertation Topics Here

Financial Investment Essay

Basics of Investment

Financial Investment – To know how to invest, first it is necessary to understand the basics of investment. To learn an investment art is more like to study a new language. A fundamental thing any successful investor needs to do is to allow his earnings to run on for a long time. Before consideration of some advance theories and practical investment, there is a need to understand the fundamental concepts and terms of investment. Money Investing is a complex thing; moreover, people often feel themselves confused due to sufficient knowledge and poor experience in this field. In this article, we will try to make main basic investment theories clear. Moreover, people should thoroughly study the investment concepts before their attempt to understand the mechanism of investment.

Risk and Return

Risk and return are the most fundamental concepts of investment. Risk and return are directly proportional data. It means, taking a high risk, investors will receive a high return and the vice versa. There is an example for comparison. Some people use to dive in the water knowing nothing about its depth. Others prefer first to measure water depth, to calculate its indicators, and then to find out about diving safety. This example proves extremely high benefits for investors to predict a possible investing risk and to imagine its future effect.

In some books on the investing theme, they consider a risk as “a chance to the actual rate of Return on Investment can differ from expected”. In other books, the risk refers to “probability of negative outcome on your investment.” Thus, people use a risk concept to calculate the level of uncertainty. To take a low risk means to expect low return, and the vice versa.

The investors stay always in a search for a right solution that will help them to achieve the best high return with the best low risk. This is an ideal situation, hard-to-finding in the current uncertain economic environment. As discussed, high risks lead investors to high returns, whereas low risk normally leads them to low returns. The rate of return on investment mainly depends on the level of risk associated with investment. It is easy graphically to explain the relation between risk and return as the figure below illustrates.

Financial Investment 01

Often people misunderstand the risk concept because of assuming that the high-risk level leads the high-return rate in any case. A high risk actually means only a possibility to provide an investor a high return, but there are no guaranties. Analogically, low-risk taking does not always lead to low return-earnings, because it is just a possibility to get low returns. Another concept necessary to understand is a risk-free rate. The risk-free rate is the rate of return on investment, achieved by investors through taking no risk.

As an example, it could be a rate of return on United States Government Bond. If the U.S. Government provided an 8% return on its bond investment, the risk-free rate would be 8%. Afterwards, the question arises: “Does investor aim to earn more than 8%?” The more he aims to benefit from the investment, the higher risk involved. Taking into account an acceptable scope of investing risk, the investor can accept a reasonable decision about his interest in the investment process. Benefits from investments can extremely vary investor to investor. There are a number of factors, affecting investors’ decisions, for example, an objective, personal situation, income level, etc.

Financial Investment Diversification

Diversification is one of vital investment basics. It is important to understand this concept to get to know why investors diversify their portfolio. Most investors cannot resist the short-term economic fluctuations, increasing as well as decreasing earnings from investments. To avoid a negative effect from economy uncertainty, investors need to diversify their investments. Diversification means managing and minimizing the risk by investing money in different sectors. As a complex concept, diversification needs its explanation through the example below.

There are two companies in a coastal area. One company sells sunscreen creams, and the other one sells umbrellas. As you can find out, the economic situation both of them depends on a season. If there were a rainy season, the umbrella company would operate with higher financial result. It is because of increase in demand for umbrellas. However, in sunny weather, the umbrella company most likely would have nothing to earn. In this situation, we have to invest a part of your investment in both the companies so that we are able to survive in both seasons.”

Diversifying investments Investors should abide by two main rules described below.

  1. It is necessary to invest money in different sectors allocating savings to stocks, cash, bonds, and in real estate. To avoid industry related risks, it is better to invest in different industrial sectors.
  2. It is necessary to invest money in companies with a variable risk. Before that, investor should choose an entity with different risk levels; moreover, blue chip shares should be not always preferred.

Diversification helps to achieve the long-term goals and makes us able to stand in short-term fluctuations. Diversifying their investment portfolios investors only minimizes the risk; however, there is no guarantee of high earnings. There is always a certain amount of risk involved no matter how much investor diversifies his investment.

Often investors wonder how many items they should use to achieve an optimum level of diversification. Experts suggest that 20 different stocks added in the portfolio are the most reasonable decision to avoid all individual risks attached with investment. Diversification means to buy the shares of the companies, variable in a size and type of industry.

Dollar Cost Averaging

The most difficult task while understanding the investment basics is picking the tops and bottoms of the stock market. Every investor aims to buy the stock at the lowest level and sell at record high level. Dollar cost averaging is a concept of buying shares for a particular amount regardless of their price. If an investor wants to buy the stocks of XYZ Company for $500 every week, we will buy the shares regardless of their price. If the price is higher, it is rather reasonable to buy fewer shares, and vice versa. The cost of the shares will be average out in the end. This technique helps to reduce the level of risk involved by purchasing shares at different prices.

Asset Allocation

Asset allocation is primarily decision about where to invest money. People, which want to invest their savings for a longer term, should invest in stocks. However, if people wish to invest for a short or medium term they should put their money in securities of different sectors and industries. Asset allocation is a technique that provides a balance in your investment and helps to diversify investments in a safe way. In asset management, it is actually necessary to divide the investment between cash, bonds, real estate, and stocks. Each of these investing directions provides its own level of risks and returns; therefore, the behavior of each sector is mainly different.

The asset allocation concept has a relation to an age of a person. Investing their money, the older people prefer to take lower risk. It is because of their savings, which in retirement generally come from the only source of income. To preserve their assets, it is safer for retirees to invest money in more conservative manner.

Another important aspect of asset allocation is to choose proper portfolio items for investment. The question arises: “How much money should we put on stocks and other securities such as bonds, securities?” Older and retired persons need more to invest in the items in which less risk is involved such as bonds and securities.

Random Walk Theory and Financial Investment

In 1973, Burton Malkiel first developed Random Walk Theory. The book titled “A Random Walk Down Wall Street” is now considered a classic investment theory. This theory states that the previous performance of any company in the stock market cannot be used to predict with precision its future performance. In 1953, this theory was first examined by Maurice Kendall stated that the fluctuations of stock prices were independent of each other.

Random Walk Theory says that the stock market always takes a random walk. People are able precisely to predict almost nothing about stock changes in the future. The chances of going the stock prices both upward and downward are equal. The followers of this theory assume a possibility to achieve high returns due to the correct calculations. Burton Malkiel stated that all types of analysis worked out to predict volatility of stock prices in the future make investors just waste their time. Malkiel supposed that only the long-term shareholding allows achieving high returns on your investment.

There are many followers of the Random Walk Theory. The others consider Investment a complex science, and they cannot invest their money based on a book written 40 years back. Today, investment basics changed as compare to 1973; moreover, nowadays people have a great access to the market news and ways to exchange views.

Hypothesis of Efficient Market

In 1960s, Eugene Fama first developed the idea of Efficient Market Hypothesis This theory states that it is not possible to beat the market as prices reflect all information. Disputed theory creates many controversies. Followers of this theory suggest futility of all types of technical and fundamental analysis.

In Efficient Market Hypothesis, investor can buy and sell shares anytime he wants. The return on investment mainly depends on a chance rather than investor’s skills. According this theory, if the stock market is efficient, the prices always go up. That is why it is useless to look for low-price shares.

Technical analysts always resist this theory due to their assumption that there is no logic in that old theory of financial investment. There are many arguments against the Efficient Market Hypothesis. As an instance, people invest their money because of the expectations, based on analysis of the company’s past performance and logical assumption about future prices.

Optimal Portfolio

The Optimal Portfolio concept is based on Modern Portfolio Theory. Harry Markowitz first introduced this concept. He stated that different portfolios provide different levels of risks as well as return. The investors should accept a right decision about how much high risk they can manage. Then, on a base of that decision, they diversify their portfolios. The figure below explains what the optimal portfolio means.

Financial Investment 02

If we look at the figure, we can see the optimal portfolio is always in the middle of the curve. Going up the straight line, portfolio reaches higher risk involved. Investors also have to think how volatile portfolio he should choose. Certainly, volatile financial investment is the one that provides investors with high returns; however, at the same time, risk involved is also higher.

Capital Asset Pricing Model

In 1952, Harry Markowitz developed Capital Asset Pricing Model, known also as a model for risky securities pricing. Some others have overhauled this concept during 60s. The model reflects the relation between risk and return. Its main idea manifests that expected return on security is equal to a sum of the security’s risk-free rate and a risk premium. If the result is lower than the required return, then it is not reasonable to invest in that option. The formula below describes Capital Asset Pricing Model.

Financial Investment 03

Expected market Return = Risk Free rate +

+ Beta × (Market Return – Risk Free Rate)

Note: Market Return – Risk Free Rate = Equity market premium

In formula above, the result largely depends on the Beta value of the security. Stock’s beta measures the sensitivity of a stock relative to the overall market or an index. The trend is that the higher Beta’s value the higher expected market return. The sensitivity of stock usually is compared to the S&P 500 Index. However, this is just a theory, and there is no guarantee that this theory gives us 100% results in a practice case.

This article is aimed to help people to understand the basic concepts of investment and give readers some ideas about how the investment theories work.

Financial Investment Relevant Posts

Investment Pension Management

View Finance Dissertation Topics Here