Behavioral Finance and the Psychology of Financial Decision
Behavioral finance and financial decisions have a big role in shaping critical decisions that people make. The study summarizes the facts about financial choices and the behavioral and psychological theories influencing them. We learn that people have predisposed cognitive constraints coupled with low levels of financial literacy, in such regard, their decision-making choices violate sound financial principles. The case studies teach us that most investors and managers over-extrapolate from past returns and trade, or they make decisions based on overconfidence and personal history.
We explain most of these behaviors based on behavioral finance theories like prospect theory, behavioral finance, and behavioral corporate finance. Many companies and institutions today shy away from traditionally defined benefit pension plans in favor of defined contribution plans, in such circumstance, the role of the financial adviser is gaining an integral value.
In this case study, a recent graduate from UMUC is employed to advise different clients on investment. The consultant delves into studying the biases in financial behavior that predict prospective theory. While applying the key concepts of behavioral finance, the consultant can recognize that the client (Violet) displays behavioral biases that impede optimal savings and consumption allocation. He can learn this by deducing from concepts of finance that assess how people organize their financial assets by creating separate slots for money designated for specific roles as well as other approaches such as mental accounting.
Expected Utility and Prospect Theory:
Unlike most of the economic theories, Expected utility theory is the most preferred by scholars ((Shiller, Robert J.). The approach attracts people because it has the best economical representation characterizing true rational behavior in uncertain situations. However, application of expected theory is criticized in many circumstances because of the systematical misrepresentation of human behavior.
Allais (503) proved that Prospect Theory refers to a mathematically developed theory that substitutes “value function” contrasted to “utility function” and “weights” contrasted to “probabilities” in expected utility theory. Here, people work to increase the weighted total value instead of utility such that probabilities do not equal weight. Simply put, people view extremely probable as certain but the improbable events as impossible.
In many circumstances, prospect theory appears inconsistent with expected utility theory. To begin with, in probabilities, utility is all linear but not value. Also, value is defined regarding losses and profits, but utility depends on final wealth.
Contrary to expected utility theory, prospect theory foretells that preferences depend on how a problem is approached. In case the reference point defines the outcome as an advantage, in this case, the resulting value function will be curved in, and those making decision will be risk-averse. But if the reference point’s outcome is seen as a loss, those making decisions will be risk seeking since is a convex value function.
Violations of Expected Utility
The possible abuses of this theory include the Allais paradox (certainty effect), and inflation of small probabilities. As for Allais paradox, there is an extreme underweighting of high probabilities. In such a case, it falls short of certainties such that the travel time outcomes become extremely attractive. On the other hand, inflation of small probabilities violation projects itself in the form of a set of stated-preference route-choice challenges.
Value Function
The definition of the value function lies on variations from a reference point, and in most circumstances, it is risk aversion–concave for gains, convex for losses. Similarly, value function is acute for losses than for profits. In this case, the stress of decisions is less compared with the equivalent probabilities, with few exceptions in the assortment of low probabilities. A value strategy deals with the purchase of stocks that have low prices compared with the dividends, earnings, book assets, or similar measures of significant value.
The Implications of Prospect Theory for the Efficient Market Hypothesis
An efficient market, based on the definition by (Fama 1965), is characterized by a large pool of rational profit maximizers who compete against each other to interpret the market prices of individual securities in the years to come; out of which a large pool of the present information is easily available to all participants. The prevailing competition in such a market opens the effects of new information on the actual prices in an instantaneous way. In such a way, the prospect theory sets in under the circumstance that makes stock price unpredictable following a random pathway.
Provided that information flow is unrestricted and quickly reflects in the stock price, the probability for the future price to change will depend not on today’s price changes, but on tomorrow’s news. Given that news is unpredictable, consequently, price changes also turnout unpredictable, and this conforms to the principle of prospect theory whereby people view extremely probable as certain but the improbable events as impossible.
Efficient Market Hypothesis is characterized by the security prices that reflect available information. It is based on the traditional view that investors use rationale in executing the present information to increase the expected utility.
Anomalies
The Anomalies of Efficient Market Hypothesis’ set in when people feel there is something wrong with the concept of Efficient Market Hypothesis. Under such conditions, the rational approaches of investors lacks consistence. It is not wholly right and must be analyzed alongside other human behavior approaches like the prospect theory, overconfidence, or expected utility, or over and under reaction, as well as the limits to arbitrage. Examples of anomalies as expressed by prospect theory include the size, valuation, and the momentum effect.
- The Valuation Effect. Studies reveal that firms with higher P/B multiples are outperformed by those with low price/book (P/B) multiples.
- The Size Effect. Studies predict that firms with smaller market capitalizations outperform those with large market capitalizations, disregard of the controls in their higher risk.
- The Momentum Effect. Studies reveal that firms with good performance for the past six months to one year period outperform those that performed poorly over the same period.
Bias identification and how such behavioral finance concepts affect their investment decisions
The First Colleague: The Concept of Illusion of Control
The stated bias happens when people overly justify their ideas. It describes people’s propensity to believe that they can exert influence on the outcomes of action when, in the real sense, they cannot. When this kind of bias occurs, people behave as if they can fully control their situations than they actually can ((Ising, Alexander).
The first colleague responds by claiming to know the technology industry and is determined to invest in them. While he might have worked in the industry for a while, it is not justifiable to assume that the circumstances will prevail in the long run. He is preoccupied with the illusion of control bias.
However, the illusion of control bias can be financially damaging since entrepreneurs might be motivated to trade more than what is right. It may lead them to employ limit orders, maintain under-diversified portfolios, or other related means just to express a false sense of influence over their trade portfolios.
People who practice this bias find it hard acceding with the irrationality and the changing nature of markets and the fact that their expectation is a failed one. The outcome is a spiral of investment catastrophe with the rationalization that while their belief is right, the one who drove the buttons was so incompetent.
In the long run, the investor becomes overconfident. The consequences of long-term investment may not be affected by the immediate-term opinion, emotions, and impulses that frequently engulf financial transactions. Rather, the success or lack of it emanates from uncontrollable factors such as the prevailing economic conditions and corporate performance.
The Second Colleague: Confirmation Bias
According to the second colleague, the value of commercial property in the city has maintained a 14% increase since the year 2000 reported a famous newspaper article. Now, this is almost two decades down the line. It is very unbelievable to assert that the value of the property has remained consistent over such a lengthy period, and very few investors would settle on that. However, depending on the interest of the reader and the prevailing circumstance, we can only assume that the type of newspaper is biased towards such reports and that the investor too is biased and love reading similar reports.
According to confirmation bias, individuals are drawn to information that substantiates their existing perceptions. It is just similar when a person prefers watching news from a TV channel that represents his/her political views while evading those that feature commentators of divergent opinions. Similarly, people behave in the like manner concerning their financial issues. Entrepreneurs believe in the market conditions will make them walk toward information sources that validate such a belief.
While it is acceptable to attach an emphasis to the consequences of our aspirations, for example, investing heavily in the stock of the firm you’re working for, it poses significant risks when it comes to diversification. If you should overcome confirmation bias, stress must be levied on obtaining information from various.
The Third Colleague: Depicting Recency Bias
Recency bias is a cognitive intrusion that encourages to perceive the most recent information as more relevant compared to the old knowledge. However, this may not be necessarily true. People base their investment decisions on how the market has been recently performing. The exact state is seen on the third respondent whose investment decisions in the Omega Corporation are drawn from the current state of the company and industry. She denotes that from the decline of the industry to capitalize on her investments since she presumes that case to remain constant for some time.
Most entrepreneurs have the inclination to follow investment performance by investing more in the industry when it is peaking and just about to reverse. Given that the investment has been picking up recently, investors anticipate that to remain the case. However, based on the behavioral theory, it would be wrong for her to rely on this approach to make financial decisions. In most circumstances, people do extrapolate from recent performance and employ them as a signal of future performance which is very wrong. Consequently, entrepreneurs fall into the ploy of over-purchasing the now outperforming asset and under-own the now drifting asset.
Behavioral Finance and Investments
Siosan’s utility function. Contrasted with that assumed in traditional finance theory
Traditional finance posits that humans are risk-averse, they love greater certainty than limited certainty and have a perfect utility function. Conversely, behavioral theorists assume that people display multiple characteristics and while they may be risk-averse, they may also be risk-seeking, risk-neutral, or any blend of the three. Depending on how things present themselves influences decision making.
The utility function measures an individual’s preferences over a set of products, measured in units referred to as utils. Utils exemplify the level of satisfaction of a consumer from choosing a specific type or number of products. Traditional finance is built on the utility theory with an assumption of diminishing marginal return. On the other hand, Behavioral theorists assume that human beings don’t always act in their best financial interests.
Appropriate in this case study, the utility function specifies the satisfaction of an investor out of all possible combinations. For example, an investment with low risk and high return has a bigger utility than that with high risk and low gain. This kind of function represents both their welfare along with their preferences. Violet expresses utility function that follows the behavioral approach. She wants to spend more. However, she’s quite unaware of the circumstances of tomorrow reflected in her limited investments. Under a traditional approach, Violet would either invest or not invest at all. It would be that she has knowledge of the future market or she does not, and if she lacks, her utility function would be concave. She would spend less just to avoid the risks in the future.
Similarly, she purchases expensive goods like cars and takes vacations for her satisfaction although, she feels reluctant to incur debts. This is opposed to traditional finance that assumes a diminishing marginal utility; Violet proposes utility function that will always satisfy her interests and won’t diminish. Violet expresses some mix of traditional and behavioral approach in some part, and traditional finance is reflected in the way she detests debts. Albeit, she does little to avert those debts, thus in part demonstrating a behavioral approach.
Siosian’s Behavioral Biases and how a rational economic individual in traditional finance would behave differently concerning each bias
Various cognitive predispositions cause several behavioral biases or under-saving inclinations. This is according to the perception by behavioral scientists who present several biases that emanate from such predispositions by grouping them into three categories. Such include preference biases, perceptions of prospects, perceptions on how to make decisions bearing in mind the rest of variables, and price perceptions. The typical behavioral bias presented in this case is the preference bias, and it manifests itself in the form of the self-control, loss aversion, and anticipatory utility.
Costly self-control bias- Living for today
Behaviorists propose that many people struggle with self-control in various fields. It may present itself through over-eating, under-saving, or over-snoozing, what we can call as “living for today”. Approaches to costly self-control also suggest that such people will value commitment such that they will choose, and even pay, to limit their future decision in some way, in an attempt to discourage their future over-consumption predilections.
However, in this case, study, Violet fits this model of costly self-control bias. We find that she engages in costly endeavors like buying expensive cars and paying for expensive meals in upscale vacation resorts. She does this at the expense of investing. In fact, she would do all the best she can to live a luxurious life while doing little on her mortgage and other investments. Her approach is behavioral and contrary to how traditional theorists would behave since they would fear the risks of tomorrow and would spend less on consumption and be concerned about the future.
Loss Aversion
The bias is comparative to some reference point like current consumption, or friends’ consumption. Loss aversion may also be seen as a potential threat to consumers leveraging their savings rates. People fear more to invest in their view of avoiding losses (Thaler, Richard, and Shlomo 164-187).
Loss aversion occurs when people easily notice the reduction in investment portfolio more than how they view gains, and this may be even when the profits are greater. They frequently get upset when they lose money during the market recession such that they remember those losses forever, but they would hardly remember the time they made 40-percent increase, just the time they lost 30-percent. We can state that Violet has an outspoken loss aversion bias when she says she detests making losses. Given that she has very little investment but high expenditure, this might be the reason why she rarely invests. Her approach reflects a traditional finance theory that assumes people are risk-averse.
Siosian’s Retirement Portfolio and Justification
Violet’s retirement portfolio is such that she maintains a minimal retirement plan where she deposits half the sum of money coming from her annual bonuses and none-salary incomes. On the other, we notice that she runs a very small mortgage and limited investments that can sustain her. Basing on such decisions, her retirement portfolio is so inefficient.
The Social Security Administration posits that on average, a 65-year pensioner can expect to stay for the next 18–20½ years after quitting the job (Benz par 3). Nonetheless, health advancements now make people stay for more years, and it would be advisable that you schedule a retirement portfolio of 30 or more years, and in such a case, the retirement saving plan becomes so essential. Rather than just depositing money in the portfolio, it should be used in investment opportunities to generate more wealth for old age. The objective is remaining invested—and that implies having some part of the money assigned to stocks, but in the right standing with other investments.
The objective of investing retirement
portfolio is to generate a mix of investments that merge to preserve capital,
create income, and expand. Such a combination of stock, bond and cash investments
must be in line with age, income, financial needs, time, and risk. For this
reason, we can say Violet’s retirement portfolio is very weak and inappropriate (Williams par 6).
Behavioral Corporate Finance
MEMO
TO: CFO
FROM:
DATE: 28/04/2019
RE: Recent Behavioral Finance Literature dealing with the Board of Directors.
We can study behavioral finance featuring the panel of executives under the concept of corporate governance ((Shivdasani, Anil, and Marc Zenner). Management of financial institutions has taken a different approach given the attrition of the significance of corporate governance in guiding financial decisions. Albeit, this is very recent studied by contemporary economists who assert the role of the board of governors in guiding the company’s value creation and improved financial performance particularly during this onset of consistent corporate flaws. Many companies have since collapsed, examples of Lehman Brothers, Rank Xerox, and Enron just to name a few, all blamed the faulty board of governors (Shivdasani, Anil, and David Yermack).
We have several lessons to learn from this shrinking–specifically–there is one lesson that stands out clear–the role of corporate governance in determining its capacity to contest positively particularly in stormy environmental conditions where others strive hard to exits.
Contemporary literature on behavioral finance vis-à-vis corporate governance emanates from Adolph, Berle and Means (23) study where they assert that, in reality, managers of companies sought their interest at the expense of the shareholders’ interests. Their investigation stressed the need for an effective plan to help aid in mitigating the conflict of interests between company owners and managers. Therefore, while the concept of corporate governance might appear new, it addresses typical concerns present since time long (Ayuso, Silvia, and Argandoña 2-19).
Many countries, corporations, and agencies across the globe have started to respond to the corporate flaws by initiating a series of legislation and guidelines that guide decisions of the board of governors in financial implications. Such rules are referred to as the codes of best practices. These legislations guide the behavior and structure of the board of directors while doing their monitory and supervisory duties (Shivdasani, Anil, and David Yermack).
Such codes, though, issued in different regions, they have similar peculiarities regarding corporate culture and general corporate environment, and alignment of the interest of parties (Shareholders and Management). Corporate governance codification of governance aims at mitigating the corresponding deficiencies in or lack of appropriate shareholders shields (Shivdasani, Anil, and David Yermack).
Your Future and Behavioral Finance Post 2008
Behavioral Finance Lessons during and after the Great Recession
Several themes emerge drawing from the issues aired by Stephanie pertaining behavioral finance during and after the great recession. While the economic downturn attracted several consequences on the corporate world, I believe the corporate directors and other stakeholders had the mandate to prevent its occurrence, and correspondingly, they can stop the reoccurrence of the same by studying behavioral finance theories. The recession affected the entire globe since businesses collapsed, and many people lost jobs and houses. However, I believe that if financial behaviorist can avoid a repeat of the 2008 great recession, they should derive from behavioral finance theories, Shefrin and Staman reports this in their book, ‘Behavioral Finance in the Financial Crisis’.
Several factors drew the crisis, and such factors persist that perpetuate the current crisis. They include; a weak government regulation, investment banks that exceedingly leverage debts, and strained homeowners’ finances. We can explain the consequences of 2008 crisis from a financial theory basis. While traditional economics base their assumptions of rationality, they assert that people make rational economic choices as they try to maximize their earnings. On the contrary, behavioral economists assume that people make their financial selections based on their emotions psychological conditions, as well as on cognitive errors.
The 2008 crisis is best explained by the principles of behavioral economics. Here, we find a correlation of the crisis with the overly optimistic lending behaviors of people since such is connected to the stock market fluctuations even as witnessed currently. Psychologists have effectively documented the propensity of people to perceive the through rose-tinted lenses, often referred to as the optimism bias.
Much of the 2008 crisis revolved around financial psychology. We can study psychology as part of the behavioral finance theory. In essence, it incorporates aspects like overconfidence, perception and cognition, aspirations, emotions, and culture (Morgenson, Gretchen and Joshua Rosner).
Overconfidence– Behavioral economists had warned of the inhibiting economic crisis. While banks, businesses, and many corporations received such warnings, many were overconfident in their investments. Overconfidence Before the great 2008 recession, economists warned that the economy was going under. Entrepreneurs were such overconfident such that they hardly analyzed the risk of holding such huge portfolios in mortgage-backed securities, provided the threat of being in a bubble. Most of the homeowners took out loans just to satisfy the American dream — they purchased during a bubble overconfident that housing prices would skyrocket and remain persistent.
However, an increase in the housing market, and the stock market, only works to raise people’s overconfidence since they would ascribe the gains or losses they achieve as a result of their proficiency in finance, although, it results from market moods.
Recency bias was one implication that cultivated the crisis. That’s because entrepreneurs make choices based on the most recent information. Decisions may be constructed on the very latest feedback. Although, such information may not be primarily relevant. During the time, investors overreacted because of the congress’s finance rescue project.
Similarly, people’s emotions such as anger, fear, and sadness influence the type of decisions made, including economic choices. More fearful people become risk-averse, but more angry people become more enthusiastic to incur risks, even financial risks. As for the economic downturn, people had others in mind to accuse of the financial crisis. Take the example of Wall Street banks that became so angry such that they easily took the financial risk to punish the offenders.
Behavioral economists assume that the kind of financial errors made aren’t haphazard, and the choice made too aren’t fundamentally rational. Rather, they are built on psychological conditions such as cognitive errors and biases.
In our attempts to evade the similar crisis in our market, we can learn a lot from the economic downturn of 20008 and the related occurrences of the past. For instance, the 1974-75 economic recession almost resembled the 2007-2009 crisis. On the same note, the twin Reagan-era recessions of the 1980s had profound consequences such as joblessness and a subsequent S&L and sovereign debt crunch. The 1990s foreign currency crisis mandated an immediate discarding of the Long-Term Capital Management without interfering with the worldwide economic system. Just like Lipsky reports, the 2008 housing bubble was a consequence of a simmering stock market.
Hindsight bias wrongly predisposes us to imagine we can see and analyze the future crises pretty well the way we do the previous and establish strategies that would impede future crises. However, we are limited to devise policies that can avert future crises should we even be able to identify them since those who would lose are in our paths standing against us. No doubt restraining bank leverage would do some good; nonetheless, bankers have the smack to strangle it. Consequently, we have a few decision left–our psychological fallibility. Assessing our psychological biases will work a great deal in averting and mitigating some crises.
Conclusion
From the discussion above, behavioral finance case studies focus on determining the clear-cut direction to which various market forces—such as rational analysis of organization-specific and macroeconomic basics; cultural, human and social psychology trends—affect investors and managers expectations and define their level of confidence.
Works Cited
Adolph, Berle, and Gardiner Means. The Modern Corporation and Private Property. New York, NY, Macmillan, 1932.
Allais, M. “Le Comportement De L’homme Rationnel Devant Le Risque: Critique Des Postulats Et Axiomes De L’ecole Americaine.” Econometrica, vol 21, no. 4, 1953, p. 503. JSTOR.
Ayuso, Silvia, and Antonio Argandoña. “Responsible Corporate Governance: Towards A Stakeholder Board of Directors?” SSRN Electronic Journal, 2009, p.2-19. Elsevier BV.
Benz, C. “The Bucket Investor’s Guide to Setting Asset Allocation for Retirement.” News.Morningstar.Com, 2016, par 3.
Ising, Alexander. “Pompian, M. (2006): Behavioral Finance And Wealth Management – How To Build Optimal Portfolios That Account For Investor Biases.” Financial Markets and Portfolio Management, vol 21, no. 4, 2007, pp. 491-492. Springer Nature.
Lipsky, J. Overcoming the Great Recession An Address to the Japan National Press Club, Remarks by John Lipsky, First Deputy Managing Director of the International Monetary Fund, at the Japan National Press Club, Tokyo, May 18, 2009. Tokyo: Japan National Press Club, 2009.
Morgenson, Gretchen, and Joshua Rosner. Reckless Endangerment: How Outsized Ambition, Greed, And Corruption Led To Economic Armageddon. New York, New York, St. Martin’s Griffin, 2012.
Shefrin Hersh, &Meir Statman. Behavioral Finance in the Financial Crisis: Market Efficiency, Minsky, and Keynes. Santa Clara: Santa Clara University, 2011.
Shiller, Robert J. “Bubbles, Human Judgment, and Expert Opinion.” Financial Analysts Journal, vol 58, no. 3, 2002, pp. 18-26. CFA Institute.
Shivdasani, Anil, and David Yermack. “CEO Involvement in the Selection Of New Board Members: An Empirical Analysis.” The Journal of Finance, vol 54, no. 5, 1999, pp. 1829-1853. Wiley-Blackwell.
Shivdasani, Anil, and Marc Zenner. “Best Practices In Corporate Governance: What Two Decades Of Research Reveals.” Journal of Applied Corporate Finance, vol 16, no. 2-3, 2004, pp. 29-41. Wiley-Blackwell.
Thaler, Richard H., and Shlomo Benartzi. “Save More Tomorrow™: Using Behavioral Economics To Increase Employee Saving.” Journal of Political Economy, vol 112, no. S1, 2004, pp. S164-S187. University Of Chicago Press.
Williams, Rob. “Plan, Allocate and Distribute: Structuring Your Retirement Portfolio for Your Income Needs.” Par 6. Schwab Brokerage, 2017.
Behavioral Finance Relevant Blog Posts
Finance Dissertation Topics
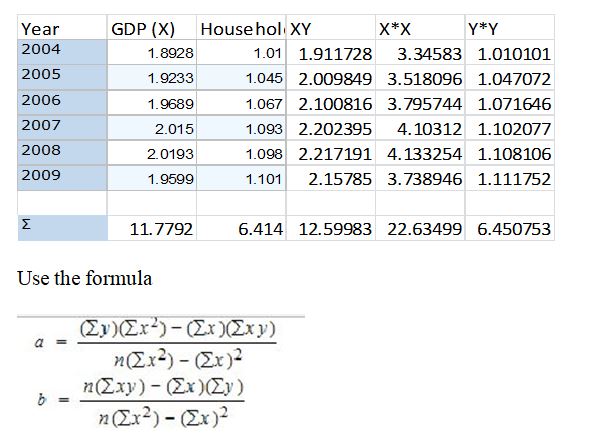
Econometrics of France – General overview of the economy, identifying the main aggregate demand components that drive GDP growth
Theories of Finance
If you enjoyed reading this post on behavioral finance, I would be very grateful if you could help spread this knowledge by emailing this post to a friend, or sharing it on Twitter or Facebook. Thank you.