Theories of Finance

Theories of Finance

Finance and Time Value of Money

Definition of Time Value of Money

The time value of money is the value of money figuring in a given amount of interest earned over a given amount of time. It means the value of an amount of money is different in different time periods. The value of a sum of money received today is less many than its value received after some time. Conversely, the sum of money received in future is less valuable than it is today. The time value of money is the central concept of finance.

For example, USD 100 of today’s money invested for one year and earning 5% interest will be worth of USD 105 after one year. Therefore, USD 100 paid now or USD 105 paid exactly one year from now both have the same value to the recipient.

Importance of Time value of money

Time value of money is considered as the fundamental concept in financial management. It can be used to compare investment alternatives and to solve problems involving loans, mortgage, leases, savings and annuities.

Financial planning

How much fund is needed? It’s needed for what’s time? What’s the sources and to this source how much money is needed is detailed description is called financial planning.

Source Identification

After financial planning the most important work of finance is to identify sources from where that fund will be collected. It’s may be a person or organization that will be decided using time value of money.

Raising Fund

Another most important task of finance is to collect funds from identified sources. The question of how much money will be invested in a particular project that will be decided through TVM.

Repayment of loan

The process of repayment of a loan is evaluated through the process of TVM.

Definition of Present Value

Present value is the current worth of a future sum of money or stream of cash flows given a specified rate of return i.e. present value is the current value of a future amount. The amount is to be invested today at a given interest rate over a specified period to equal the future amount.

The present value formula has four variables. The formula is –

PV=FV/ (1+i) n

Definition of Future Value

Future value is the value of an asset or cash at a specified date in the future that is equivalent in value to a specified sum today. It measures the nominal future sum of money that a given sum of money is worth at a specified time in the future assuming a certain interest rate or more generally rate of return. It is the present value multiplied by the accumulation function.

Following is the future value formula-

FV=PV (1+r) t

Definition of Annuity

An annuity, in finance is a terminating streams of fixed payments i.e. a collection of payment to be periodically received over a specified period of time. The valuation of such a stream of payment s entails concepts such as the time value of money, interest rate and future value. For example- annuities are regular deposits to a savings account, monthly home mortgage payments and monthly insurance payments.

Annuity can be classified by the frequency of payment date. The payments may be made weekly, monthly, quarterly, yearly etc.

Finance Amortization

Amortization is the process of decreasing or accounting for an amount over a period. In the concept of finance amortization is the process by which loan principle decreases over the life of a loan. An amortization table shows this ratio of principle and interest and demonstrates how a loan’s principle amount decreases over time. Amortization is generally known as depreciation of intangible assets of a firm.

Amortization Schedule

It is a table detailing its periodic payment on an amortizing loan as generated by an amortization calculator. This amortization schedule is based on the following assumptions;

First, it should be known  that rounding errors occur and depending how the lender accumulates this error, the blended payment may vary slightly some months to keep this error are adjusted for at the end of each year or at the final loan payment. There are a few crucial points worth noting when mortgaging a home with an amortized loan.

Second, understanding the first statement, the repetitive refinancing of an amortized mortgage loan even with decreasing interest rates and decreasing principle balance, can cause the borrower to pay over 500% of the value of the original loan amount.

Third, the payment on an amortized mortgage loan remains same for the entire loan term, regardless of principle balance owed but only for a fixed rate, fully amortizing loan.

Theories of Finance
Theories of Finance

Methods of Amortization

There are different methods in which to arrive at an amortization schedules. These are;

  • Straight line
  • Declining Balance
  • Annuity
  • Bullet
  • Balloon
  • Increasing Balance (Negative Amortization)

Capital Budgeting

Capital budgeting is the process of evaluating and selecting long term investments that are consistent with the goals of the shareholder’s profit maximization.

PBP

Payback period is defined as the number of years required to recover a project cost. The regular pay back method ignores cash flow beyond payback period and it does not consider the time value of money. The payback provides an indication on a project’s risk and liquidity, because it shows how long the invested capital is at risk.

NPV

The net present value method discounts all cash flows at the project’s cost of capital and then sums those cash flows:

Acceptance rule- Accept if NPV>0
Reject if NPV<0
Project may be accepted if NPV=0

Merits

  • Considers all cash flow
  • True measure of profitability.
  • Based on the concept of Time value of money.
  • Satisfies the value audibility principle.
  • Consistent with the wealth maximization principle.

Demerits

  • Requires estimates of all cash flows.
  • Requires computation of the opportunity cost of the capital that possesses practical difficulties.
  • Sensitive to discount rates.

IRR

The discount rate that equates the present values of an investment, the cash inflows and outflows is its Internal Rate of Return.

Acceptance rule- Accept if IRR>k,
Reject if IRR<k,
Project may be accepted if IRR=0.

Merits

  1. Considers all cash flows.
  2. True measure of profitability.
  3. Based on the concept of time value of money.
  4. Generally consistent with profit maximization principle.

Demerits

  1. Requires estimates of cash flows.
  2. Does not satisfy the value audibility concept.
  3. At times, fails to indicate correct choice between mutually exclusive projects.
  4. At times, yields multiple rates.
  5. Relatively difficult to compute.

PI

The ratio between the present value of the net cash benefit to the net cash outlay is profitability index or benefit-cost ratio;

Acceptance rule- Accept if PI>1.0,
Reject if PI<1.0,
Project may be accepted if PI=1.0

Cost of Capital

Definition of cost of capital

It is the rate that a firm must earn on its project investments to maintain its market value and attract funds.

The cost of each source or component is called specific cost of capital. When these specific costs are combined to arrive at overall cost of capital, it is referred to as the weighted cost of capital.

Assumptions

A basic assumption of traditional cost of capital analysis is that the firm’s business and financial risks are unaffected by the acceptance and financing of projects.

Business risks

It is the risk to the firm of being unable to cover fixed operating costs.

Financial risks

It is the risk to the firm of being unable to cover required financial obligations such as interest and preference dividends.

Explicit Costs

Explicit cost of capital is the “rate of return of the cash flows of the financing opportunity”.

Implicit Cost

Implicit cost of capital of funds raised and invested by the firm may, therefore, be defined as the rate of return associated with the best investment opportunity for the form and its shareholders that would be foregone.

Cost of debts

Cost of debt is the after tax cost of long-term funds through borrowing.

Cost of preference stocks

It is the annual preference stock dividend divided by the net proceeds from the sale of preference stocks. Or it can be said as the dividend expected by the preference stockholder.

Finance and Working Capital Cycle

Definition of Working Capital

 Working Capital refers to that part of the firm’s capital, which is required for financing short-term or current assets such a cash marketable securities, debtors and inventories.  Funds thus, invested in current assets keep revolving fast and are constantly converted into cash and this cash flow out again in exchange for other current assets.  Working Capital is also known as revolving or circulating capital or short-term capital.

Why finance working capital cycle is calculated

Working capital is a common measure of a company’s liquidity, efficiency, and overall health. Because it includes cash, inventory, accounts receivable, accounts payable, the portion of debt due within one year, and other short-term accounts, a company’s working capital reflects the results of a host of company activities, including inventory management, debt management, revenue collection, and payments to suppliers.

Positive working capital generally indicates that a company is able to pay off its short-term liabilities almost immediately. Negative working capital generally indicates a company is unable to do so. This is why analysts are sensitive to decreases in working capital; they suggest a company is becoming over leveraged, is struggling to maintain or grow sales, is paying bills too quickly, or is collecting receivables too slowly. Increases in working capital, on the other hand, suggest the opposite. There are several ways to evaluate a company’s working capital further, including calculating the inventory-turnover ratio, the receivables ratio, days payable, the current ratio, and the quick ratio.

One of the most significant uses of working capital is inventory. The longer inventory sits on the shelf or in the warehouse, the longer the company’s working capital is tied up.

When not managed carefully, businesses can grow themselves out of cash by needing more working capital to fulfill expansion plans than they can generate in their current state. This usually occurs when a company has used cash to pay for everything, rather than seeking financing that would smooth out the payments and make cash available for other uses. As a result, working capital shortages cause many businesses to fail even though they may actually turn a profit. The most efficient companies invest wisely to avoid these situations.

Analysts commonly point out that the level and timing of a company’s cash flows are what really determine whether a company is able to pay its liabilities when due. The working-capital formula assumes that a company really would liquidate its current assets to pay current liabilities, which is not always realistic considering some cash is always needed to meet payroll obligations and maintain operations. Further, the working-capital formula assumes that accounts receivable are readily available for collection, which may not be the case for many companies.

It is also important to understand that the timing of asset purchases, payment and collection policies, the likelihood that a company will write off some past-due receivables and even capital-raising efforts can generate different working capital needs for similar companies. Equally important is that working capital needs vary from industry to industry, especially considering how different industries depend on expensive equipment, use different revenue accounting methods, and approach other industry-specific matters.

Finding ways to smooth out cash payments in order to keep working capital stable is particularly difficult for manufacturers and other companies that require a lot of up-front costs. For these reasons, comparison of working capital is generally most meaningful among companies within the same industry, and the definition of a “high” or “low” ratio should be made within this context.

Finance Theories Relevant Blog Posts

Corporate Finance And Governance

Click Here To View Finance Dissertation Titles

Financial Investment Essay

Basics of Investment

Financial Investment – To know how to invest, first it is necessary to understand the basics of investment. To learn an investment art is more like to study a new language. A fundamental thing any successful investor needs to do is to allow his earnings to run on for a long time. Before consideration of some advance theories and practical investment, there is a need to understand the fundamental concepts and terms of investment. Money Investing is a complex thing; moreover, people often feel themselves confused due to sufficient knowledge and poor experience in this field. In this article, we will try to make main basic investment theories clear. Moreover, people should thoroughly study the investment concepts before their attempt to understand the mechanism of investment.

Risk and Return

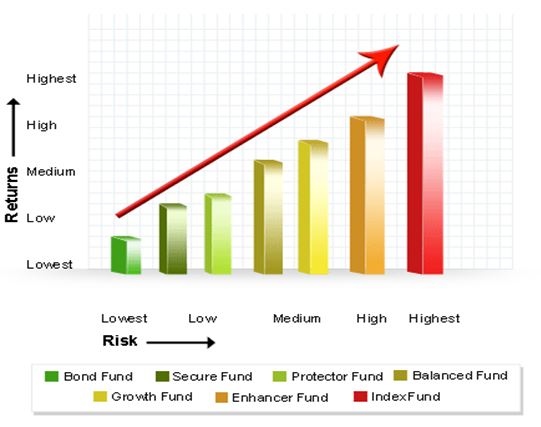
Risk and return are the most fundamental concepts of investment. Risk and return are directly proportional data. It means, taking a high risk, investors will receive a high return and the vice versa. There is an example for comparison. Some people use to dive in the water knowing nothing about its depth. Others prefer first to measure water depth, to calculate its indicators, and then to find out about diving safety. This example proves extremely high benefits for investors to predict a possible investing risk and to imagine its future effect.

In some books on the investing theme, they consider a risk as “a chance to the actual rate of Return on Investment can differ from expected”. In other books, the risk refers to “probability of negative outcome on your investment.” Thus, people use a risk concept to calculate the level of uncertainty. To take a low risk means to expect low return, and the vice versa.

The investors stay always in a search for a right solution that will help them to achieve the best high return with the best low risk. This is an ideal situation, hard-to-finding in the current uncertain economic environment. As discussed, high risks lead investors to high returns, whereas low risk normally leads them to low returns. The rate of return on investment mainly depends on the level of risk associated with investment. It is easy graphically to explain the relation between risk and return as the figure below illustrates.

Financial Investment 01

Often people misunderstand the risk concept because of assuming that the high-risk level leads the high-return rate in any case. A high risk actually means only a possibility to provide an investor a high return, but there are no guaranties. Analogically, low-risk taking does not always lead to low return-earnings, because it is just a possibility to get low returns. Another concept necessary to understand is a risk-free rate. The risk-free rate is the rate of return on investment, achieved by investors through taking no risk.

As an example, it could be a rate of return on United States Government Bond. If the U.S. Government provided an 8% return on its bond investment, the risk-free rate would be 8%. Afterwards, the question arises: “Does investor aim to earn more than 8%?” The more he aims to benefit from the investment, the higher risk involved. Taking into account an acceptable scope of investing risk, the investor can accept a reasonable decision about his interest in the investment process. Benefits from investments can extremely vary investor to investor. There are a number of factors, affecting investors’ decisions, for example, an objective, personal situation, income level, etc.

Financial Investment Diversification

Diversification is one of vital investment basics. It is important to understand this concept to get to know why investors diversify their portfolio. Most investors cannot resist the short-term economic fluctuations, increasing as well as decreasing earnings from investments. To avoid a negative effect from economy uncertainty, investors need to diversify their investments. Diversification means managing and minimizing the risk by investing money in different sectors. As a complex concept, diversification needs its explanation through the example below.

There are two companies in a coastal area. One company sells sunscreen creams, and the other one sells umbrellas. As you can find out, the economic situation both of them depends on a season. If there were a rainy season, the umbrella company would operate with higher financial result. It is because of increase in demand for umbrellas. However, in sunny weather, the umbrella company most likely would have nothing to earn. In this situation, we have to invest a part of your investment in both the companies so that we are able to survive in both seasons.”

Diversifying investments Investors should abide by two main rules described below.

  1. It is necessary to invest money in different sectors allocating savings to stocks, cash, bonds, and in real estate. To avoid industry related risks, it is better to invest in different industrial sectors.
  2. It is necessary to invest money in companies with a variable risk. Before that, investor should choose an entity with different risk levels; moreover, blue chip shares should be not always preferred.

Diversification helps to achieve the long-term goals and makes us able to stand in short-term fluctuations. Diversifying their investment portfolios investors only minimizes the risk; however, there is no guarantee of high earnings. There is always a certain amount of risk involved no matter how much investor diversifies his investment.

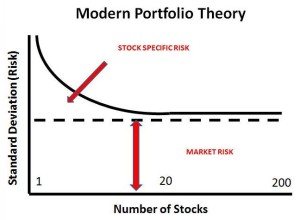
Often investors wonder how many items they should use to achieve an optimum level of diversification. Experts suggest that 20 different stocks added in the portfolio are the most reasonable decision to avoid all individual risks attached with investment. Diversification means to buy the shares of the companies, variable in a size and type of industry.

Dollar Cost Averaging

The most difficult task while understanding the investment basics is picking the tops and bottoms of the stock market. Every investor aims to buy the stock at the lowest level and sell at record high level. Dollar cost averaging is a concept of buying shares for a particular amount regardless of their price. If an investor wants to buy the stocks of XYZ Company for $500 every week, we will buy the shares regardless of their price. If the price is higher, it is rather reasonable to buy fewer shares, and vice versa. The cost of the shares will be average out in the end. This technique helps to reduce the level of risk involved by purchasing shares at different prices.

Asset Allocation

Asset allocation is primarily decision about where to invest money. People, which want to invest their savings for a longer term, should invest in stocks. However, if people wish to invest for a short or medium term they should put their money in securities of different sectors and industries. Asset allocation is a technique that provides a balance in your investment and helps to diversify investments in a safe way. In asset management, it is actually necessary to divide the investment between cash, bonds, real estate, and stocks. Each of these investing directions provides its own level of risks and returns; therefore, the behavior of each sector is mainly different.

The asset allocation concept has a relation to an age of a person. Investing their money, the older people prefer to take lower risk. It is because of their savings, which in retirement generally come from the only source of income. To preserve their assets, it is safer for retirees to invest money in more conservative manner.

Another important aspect of asset allocation is to choose proper portfolio items for investment. The question arises: “How much money should we put on stocks and other securities such as bonds, securities?” Older and retired persons need more to invest in the items in which less risk is involved such as bonds and securities.

Random Walk Theory and Financial Investment

In 1973, Burton Malkiel first developed Random Walk Theory. The book titled “A Random Walk Down Wall Street” is now considered a classic investment theory. This theory states that the previous performance of any company in the stock market cannot be used to predict with precision its future performance. In 1953, this theory was first examined by Maurice Kendall stated that the fluctuations of stock prices were independent of each other.

Random Walk Theory says that the stock market always takes a random walk. People are able precisely to predict almost nothing about stock changes in the future. The chances of going the stock prices both upward and downward are equal. The followers of this theory assume a possibility to achieve high returns due to the correct calculations. Burton Malkiel stated that all types of analysis worked out to predict volatility of stock prices in the future make investors just waste their time. Malkiel supposed that only the long-term shareholding allows achieving high returns on your investment.

There are many followers of the Random Walk Theory. The others consider Investment a complex science, and they cannot invest their money based on a book written 40 years back. Today, investment basics changed as compare to 1973; moreover, nowadays people have a great access to the market news and ways to exchange views.

Hypothesis of Efficient Market

In 1960s, Eugene Fama first developed the idea of Efficient Market Hypothesis This theory states that it is not possible to beat the market as prices reflect all information. Disputed theory creates many controversies. Followers of this theory suggest futility of all types of technical and fundamental analysis.

In Efficient Market Hypothesis, investor can buy and sell shares anytime he wants. The return on investment mainly depends on a chance rather than investor’s skills. According this theory, if the stock market is efficient, the prices always go up. That is why it is useless to look for low-price shares.

Technical analysts always resist this theory due to their assumption that there is no logic in that old theory of financial investment. There are many arguments against the Efficient Market Hypothesis. As an instance, people invest their money because of the expectations, based on analysis of the company’s past performance and logical assumption about future prices.

Optimal Portfolio

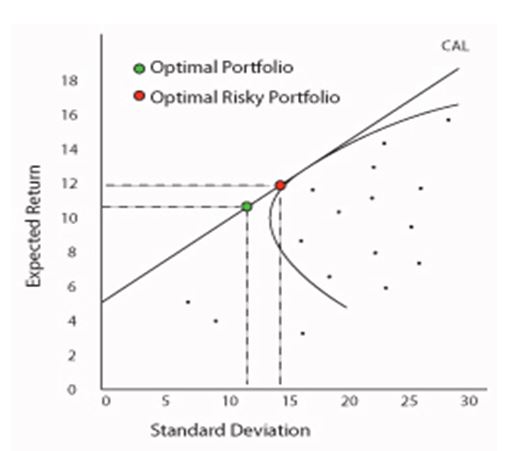
The Optimal Portfolio concept is based on Modern Portfolio Theory. Harry Markowitz first introduced this concept. He stated that different portfolios provide different levels of risks as well as return. The investors should accept a right decision about how much high risk they can manage. Then, on a base of that decision, they diversify their portfolios. The figure below explains what the optimal portfolio means.

Financial Investment 02

If we look at the figure, we can see the optimal portfolio is always in the middle of the curve. Going up the straight line, portfolio reaches higher risk involved. Investors also have to think how volatile portfolio he should choose. Certainly, volatile financial investment is the one that provides investors with high returns; however, at the same time, risk involved is also higher.

Capital Asset Pricing Model

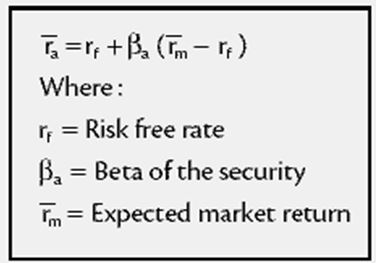
In 1952, Harry Markowitz developed Capital Asset Pricing Model, known also as a model for risky securities pricing. Some others have overhauled this concept during 60s. The model reflects the relation between risk and return. Its main idea manifests that expected return on security is equal to a sum of the security’s risk-free rate and a risk premium. If the result is lower than the required return, then it is not reasonable to invest in that option. The formula below describes Capital Asset Pricing Model.

Financial Investment 03

Expected market Return = Risk Free rate +

+ Beta × (Market Return – Risk Free Rate)

Note: Market Return – Risk Free Rate = Equity market premium

In formula above, the result largely depends on the Beta value of the security. Stock’s beta measures the sensitivity of a stock relative to the overall market or an index. The trend is that the higher Beta’s value the higher expected market return. The sensitivity of stock usually is compared to the S&P 500 Index. However, this is just a theory, and there is no guarantee that this theory gives us 100% results in a practice case.

This article is aimed to help people to understand the basic concepts of investment and give readers some ideas about how the investment theories work.

Financial Investment Relevant Posts

Investment Pension Management

View Finance Dissertation Topics Here

Financial Statements CEMEX

Financial Statements CEMEX

CEMEX is one of the largest building materials suppliers and cement producers in the world. The company produces, distributes and sells cement, mix-concrete, aggregates, and related building materials in more than 50 countries in all over the world. CEMEX has a rich history of improving the well-being of those it serves through its efforts to pursue innovative industry solutions and efficiency advances and to promote a sustainable future. CEMEX is recovering from the global economic recession and the loss that the company had in the last couple of years. The year 2011 compared with the year 2010, the company had a good impact.

Introduction Financial Statements

CEMEX is one of the largest building materials suppliers and cement producers in the world. The company produces, distributes and sells cement, mix-concrete, aggregates, and related building materials in more than 50 countries in all over the world. CEMEX has a rich history of improving the wellbeing of those it serves through its efforts to pursue innovative industry solutions and efficiency advances and to promote a sustainable future.

The aim of this paper is to evaluate the performance of CEMEX through a critical analysis of the financial statements of the last two years, the analysis of five aspects of performance evaluation which are profitability, efficiency, short and long term Solvency and market based ratios. In this analysis will include the information of the company CEMEX, and the analysis of the financial information.

CEMEX background

CEMEX is one of the largest cement companies in the world, was founded in Mexico in 1906, the company is based in Monterrey, Nuevo Leon, Mexico and has operations throughout the world with production facilities in 50 countries in North America, Caribbean, South America, Europe, Asia and Africa (Cemex, 2012).

CEMEX had an annual cement production of production capability of 82 million tons. One third of the sales come from Mexico operations, one quarter comes from the plants in USA, 15% from Spain operations and other small percentages from the other plants in the world (Cemex, 2012). The main competitors of CEMEX are Holcim, Lafarge and Heidelberg Cement. CEMEX is constantly evolving to become more flexible in their operations, more creative in the commercial offerings, more sustainable in the use of the resources, more innovative in their global business and more efficient in their capital allocation.

Interpretation of accounts: ratio analysis

In this analysis we review the financial statements (Balance Sheet, Cash flow and income statement) of the company CEMEX. These to evaluate the performance of the company in the different aspects.

  1. Profitability ratios. An expectation on making more income from sales of the good or service than they spend performing the services or making the goods.
  2. Efficiency ratios. A level of performance that describes a process that uses the lowest amount of inputs to create the greatest amount of outputs.
  3. Short-term solvency ratios. Measure a company’s ability to pay its current bills and operating costs – obligations coming due in the next fiscal year.
  4. Long-term solvency ratios. Measure a company’s ability to meet it’s long term obligations, such as it long term debts (bank loans) and to survive over a long period of time.
  5. Market indicators. These ratios relate the current market price of the company’s stock to earnings or dividends (Reimers, JL, 2008).

Financial Statements CEMEX

Analysis of Financial Statements

The year 2011 was an important year for CEMEX, after the global economic recession the company is facing a difficult situation with some of the markets, nevertheless CEMEX launched an accurate transformation designed to make the company more efficient, more agile and more customer focused. The changes made in the company, designed to position the company for a future of beneficial growth, are already showing results. The results of the ratios of the 2011 financial statements are the next ones:

2011 2010
Gross profit margin 28.5% 28%
Net profit margin -10.24% -9%
Operating margin 6.3% 2.5%
Return on assets -3.5% -3.1%
Return on equity -10% -8.2%

Table 4.1 Profitability ratios

2011 2010
Current ratio 1.04:1 0.98:1
Quick ratio 0.73:1 0.71:1

Table 4.2 Liquidity ratios

2011 2010
Inventory turnover 10.77 11.80
Assets turnover 34% 34%

Table 4.3 Efficiency ratios

2011 2010
Debt to equity 65% 62%
Total debt/total equity 1.25 1.04
Total debt / total capital 55.59% 51%

Table 4.4 Solvency ratios

After the global economic recession CEMEX is facing difficult situations, in table 4.1 the gross profit shows that the company has 28.5% in 2011, compared with 2010 is almost the same; in the table 4.1 shows the gross margin in 2010 was 28%, there was an increase of 0.5%. In the table 4.1 shows that the company had a loss in the net profit, the ROA and the ROE in the last two years but an increase on the operating margin compared with the year 2010, in year 2010 was 2.5% and the year 2011 increase to 6.3%. That means that the company is profitable, there were some difficult situations the last couple of years nevertheless the company is making a profit.

With the information of the financial statements we can determine that the company is facing some problems with the ability of paying current bills and operating costs, in the table 4.2 the current ratio of the year 2011 is 1.04 on the year 2010 was 0.98, there was an increase this year, although the ideal ratio is 2:1, this year the current and quick ratio were below the ideal ratio. In the table 4.2 the quick ratio in 2011 was 0.73 and in the year 2010 was 0.71, the ideal for the quick ratio is 1:1. Table 4.5 shows that the company has a debt to total capital of 55.59%.

The table 4.3 shows that the company is turning over the inventory 11 times in the year 2011, the year 2010 the turning over of the inventory was 12 times in a year. The average is 12 times. The assets turnover in the year 2011 is of 34%, this value is the same than the year 2010, and this means that the company is efficient.

The market indicators for CEMEX for the year 2011 are book value per share is 17.54 and the tangible book value per share is 2.94. The earning per share in 2011 is -11.13, that means that there were losses; the earnings per share excluding extraordinary items dropped 13.71% (Financial Times, 2012).

Comparing CEMEX in the last 4 years there was a significant deterioration on the operating margin and the EBITDA margin, from the year 2008 to the year 2011 year. Now the company is increasing the operating margin, this year have an improvement compared to year 2010, this deterioration was in the time of the global economic recession.

Conclusion and recommendations

CEMEX is recovering from the global economic recession and the loss that the company had in the last couple of years. The year 2011 compared with the year 2010, the company had a good impact on the operating margin and the gross profit margin it increases a 6.3% on operating margin. That means that the company is profitable but has some losses in the return on Assets and the return on equity, on the solvency part the current ratio and quick ratio are below the ideal, the company needs to keep an eye on the solvency of the company, the company has a little improvement on the efficiency on the inventory turnover, nevertheless the company has a debt of 55.59%. The company is doing better than last year and has some projects to increase the sales, improve operation, be more creative in the commercial offerings, more sustainable in the use of the resources, more innovative in their global business and more efficient in their capital allocation, the recommendations are to keep those projects and further expand them.

References

CEMEX, “CEMEX annual report” 2011 3. Financial Times “Strong sales boost CEMEX recovery”

Financial Times “CEMEX to meet all debt covenants”

Financial Times “Losses put CEMEX under pressure”

Financial Times “CEMEX to cut debt in stake sales”

Merrill lynch, “How to read a financial report” 2000

Pratt, J, “Financial accounting in an economic context” 2000, 4th edition, southwestern Thomson learning.

Reimers, JL, “Financial accounting a business approach” 2008, 2nd edition, Pearson education.

Appendixes

Profitability

GPM (2010) = GP/sales = 49953/178260 = 0.280 = 28%

GPM (2011) = 53871/188938= 0.285 = 28.5%

NPM (2010) = NIAT/sales = -16099/178260 = 0.090 = -9%

NPM (2011) = -19163/188938 = -.1014 = -10.14%

OM (2010) = OI/net sales = 4561/178260 = 0.025 = 2.5%

OM (2011) = 11984/188938 = 0.063 = 6.3%

ROA (2010) = net income/ total assets = -16126/515097 = -0.031 = –3.1%

ROA (2011) = -19127/548299 = -0.035 = -3.5%

ROE (2010) = IAT/SE = -16099/19176 = -0.082 = -8.2%

ROE (2011) = -19163/191016 = -0.10 = -10%

Solvency

CR (2010) = CA/CL = 54567/85119 = 0.98 = 0.98:1 ideal 2:1

CR (2011) = 58947/56670 = 1.04 = 1.04:1 ideal 2:1

QR (2010) = (CA-I)/CL = 39469/55119 = 0.71 = 0.71:1 ideal 1:1

QR (2011) = 41408/56670 = 0.73 = 0.73:1 ideal 1:1

TD/TE (2010) = 202819/194176 = 1.04

TD/TE (2011) = 239116/191016 = 1.25

Efficiency

Inventory Turnover (2010) = Sales/stock = 178260/15098 = 11.80 = 12 times/year

Inventory Turnover (2011) = 188938/17539 = 10.77 = 11 times/year

Assets Turnover (2010) = sales/total assets = 178260/515097 = 0.34 = 34%

Assets Turnover (2011) = 188938/548299 = 0.34 = 34%

Click Here To View Finance Dissertation Topics

Modern Portfolio Theory

Why Investors Decline Modern Portfolio Theory

There is no doubt that any investor would ideally choose a portfolio which would give him high returns and put him through low risk. However, the investment world and its choices are not that simple and easy. Many times, the choices have to be made under difficult circumstances. But there are quite a few portfolio management tools and theories that can come to the rescue of the investor in making his choices. In this paper we will be discussing about one of prominent theories in this aspect. We would also try why many investors do not invest according to the theory. The portfolio management theory that is being discussed in this paper is the modern portfolio theory.

Modern Portfolio Theory was first introduced to the financial world by future Nobel laureate, Harry Markowitz through his research paper in 1952. In 1959 Markowitz also wrote a book, Portfolio Selection, based on the same. He used mathematics to explain the relationship of risk to return as it relates to asset allocation. It was agreed that in cases where high returns were expected, the risk factor associated with it was also very high. However, he proved that asset classes acted differently during a market cycle. The paper also discussed how an investor can construct an investment portfolio based on his risk tolerance levels and expectation for returns (Omisore and Yusuf et al. 2012, pp. 19-28).

To put it in simpler words, stocks are generally associated with high risk and high returns. And hence if an investor buys more stocks, he might be exposing himself to too much risk. On the other hand, bonds are known for moderate returns and lower risk. Hence, according to modern portfolio theory, if an investor opts for a combination of stocks and bonds, his chances of getting a reasonable return while handling a relatively lower level of risk, increases. In short this theory for portfolio management encourages asset diversification.

Modern Portfolio Theory

However, recent studies have shown that most of times the investor does not take his investment decisions as per modern portfolio theory. This observation is made on the basis that though the benefits of diversification have increased in the recent years, considering the mean–variance portfolio theory, it is surprising to see that the level of diversification in investor portfolios has not increased accordingly. While the level of diversification exceeds much more than 300 stocks, the actual number of stocks that the investor holds remains just 3-4 (Statman 2004, pp. 44-52).

Management of Risk and Return

Many critics of modern portfolio theory would point out that this method of choosing the right investment path has ignored the part played by analysis of market and its trends. And this is also one of the key reasons that the investors cite to avoid much diversification of their assets. They believe that risk can be managed with the help of right knowledge and trading skills. This makes many to invest in high risk assets with the hope of getting more returns. They remain under the impression that in case a bear a market happens they will be quick to realize it and would sell off their high risk assets at a reasonable price. At times they also choose other alternatives to reduce the risk factor such as delegation of authority or decision delay, making them feel that they have taken a well calculated risk. And amidst all these they miss out on the diversification of their assets as they consider having solid information about a few firms better than opting for diversification (Werner F.M. De Bondt 1998, pp. 831-844).

Trading Practices

Though investors and traders try to put in practice a variety of rules and techniques, to keep their emotions at bay and let their reasons speak while making investment decisions, most of the time trading happens out of impulse. They end up buying or selling their assets without prior planning or by listening to some random suggestions made by an acquaintance (Werner F.M. De Bondt 1998, pp. 831-844).

It is also interesting to see how investors decide upon buying shares in a bull market and selling them off in a bear market. In some of the cases even the experts, who are known for taking decision in the most rational way, based upon accurate models, at times find themselves going after the crowd mentality.

Misunderstanding Modern Portfolio Theory

One another reason for many investors for not choosing the modern portfolio theory way of investing is that they confuse it with ‘buy and hold’ strategy which is done with the intention of reaping good returns in the long run. However, this is not the case with the modern portfolio theory. Though it may resemble with the ‘buy and hold’ manner of investing, as an investor who opts for modern portfolio theory will remain fully invested, it is misleading to say that the assets will remain unmanaged. As mentioned earlier, a rebalancing of holdings is always needed in accordance to mean–variance portfolio theory. This would mean that the total assets need to rebalance either quarterly or annually to keep them in line with their original portfolio percentages (Hudson Wealth Management LLC 2013).

Conclusion

It is understood that the basic fact of investing is that the investors are rewarded for taking high risks. However, not all risk is rewarded. Further, in the current economic scenario, there are not many who can really afford to take a hit. In cases for investors who hold on to a high number of high risk and highly rewarding assets are also at a greater of risk of facing a financial crisis. Hence, it is better to go with a disciplined modern portfolio theory approach of diversification which has been theoretically and practically proven for the last 60 years and have proven the ability to maximize the returns and minimize risks.

References

Omisore, I., Yusuf, M. and Christopher, N. 2012. The modern portfolio theory as an investment decision tool. Journal of Accounting and Taxation, 4 (2), pp. 19-28.

Statman, M. 2004. The Diversification Puzzle. Financial Analysts Journal, 60 (4), pp. 44-52.

Werner F.M. De Bondt. 1998. A Portrait of the Individual Investor. European Economic Review, 42 pp. 831-844.

Hudson Wealth Management LLC. 2013. What Is Modern Portfolio Theory and is it Still Effective?

View Finance Dissertation Topics Here

Activity Based Costing

Financial Management Concepts and Their Application – Focus on Activity Based Costing

The process or the technique of determining the cost of a service or a product is called cost accounting system. The costs are assigned to cost objects only after collected and classified by the cost accounting system. It is used to estimate the cost involved in developing, designing, purchasing, producing, servicing, distributing and selling different services or products. The heart of cost accounting system is cost allocation and Activity Based Costing (ABC) can be considered as a type of cost allocation. In this essay, different approaches to cost allocation and activity based costing are described. The methods used for cost allocation and activity based costing. Activity based costing received focus when attempts were made to improve the methods of cost allocation. The different ways of implementing cost allocation and ABC approaches in for- profit organizations (corporations) and in real world business enterprises (Akyol and Bayhan, 2005).

Like any other approach involved in business activities cost allocation and activity based costing also have their strengths and weaknesses and a detailed study of these factors ensures the successful implement of these account systems. The costs associated with these account practices are very crucial and they must be considered very carefully in terms of benefits earned by implementing cost allocation and ABC approaches. These systems could be viable only if they are implemented efficiently and they gain efficiency and profitability.

The study further discusses about the main objectives of cost allocation and ABC approaches and the relation between various factors like resources, costs, cost drivers and activities. It also signifies the methods of cost allocation like direct allocation, step- down allocation and reciprocal allocation. Activity Based Costing (ABC) has been discussed elaborately for allocating costs to services or products and the different steps involved in the process. The recommendations made in this paper could be used by the users as guideline for charging the fixed and variable costs of one department to other department of the organization (Peter B.B. 1997).

Cost Allocations and Activity Based Costing (ABC)

The process or the technique of determining the cost of a service or a product is called cost accounting system. The costs are assigned to cost objects only after collected and classified by the cost accounting system. Therefore, the process by which some costs or groups of costs are linked with one or more cost objectives, like divisions, departments and products, is basically called cost allocation. Generally, cost objectives which are responsible for causing costs are allocated costs. Costs are linked with cost objectives by selecting appropriate cost drivers. A cost driver is called cost allocation base when it is used for allocating cost. Major costs are allocated, such as cost of raw material for a manufacturing firm or cost of building material for a construction firm are allocated to departments, projects and jobs on an item basis by utilizing cost drivers like quintals of raw materials or tonnes of building materials consumed where as other costs, considering individually, may not be so significant that they need to be allocated individually (Peter B.B. 1997).

They are pooled and then they are allocated together. Hence, a cost pool may be defined as a set of single costs allocated to cost objectives utilizing an individual cost driver. For instance cost of everything which are measured in square meters and occupy space like rent of the building, cost of utilities and janitorial services can be pooled together for allocation. Or all the operating expenses of the registrar’s office of a university can be pooled together and it can be allocated to the respective colleges as per the quantity of students enrolled with each department.

In brief, the costs caused by the same factor should be given in the same pool. Those factors are called cost driver. In practice, many terms are used by the companies for describing cost allocation. Such terms can be attributing, trace, allocate, reallocate, distribute, assign, burden, load, reapportion, apportion, etc. For describing allocation of costs to cost objectives any of the above mentioned terms could be utilized interchangeably (Cooper and Kaplan, 1988).

Activity Based Costing Dissertation

The type of methodology used to measure the cost and the performance of different activities, cost objects and resources is known as the Activity Based Costing (ABC) and it is one of the most important aspects of the organizations engaged in specially manufacturing or service. For the traditional accounting systems based on costs it is regarded as the best alternative epitome of the accounting system. Presently, the organizations engaged in manufacturing and service sector are forced by the global competition for increasing productivity and reducing associated costs and for this they have to be greatly automated and more integrated and flexible.

They can only sustain in this competitive world if they adapt to a mechanism of calculating costs which is more than accurate. Activity based costing is regarded as the best alternative of the traditional methods of cost accounting and it is used now a days for assigning costs, using various cost drivers, to activities, further for allocating costs to products on the basis of use of these products for these activities. ABC is used to reduce the stake of distortion and gives information about costs accurately by utilizing various activities as cost drivers (Akyol , and Bayhan, 2005).

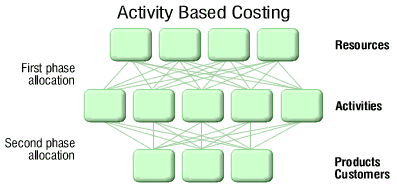
According to activity based costing, the total cost of a product or a service is calculated by adding the cost of all value added activities involved in the production with the cost of the raw material. It can be explained in different words as the activity based costing method is used to link the cost of activities performed for usages of the resources of the organization (inputs) to the final outputs like services, customers and above all products. Purchasing, engineering, technology, design, quality control and production are prime activities required for a product and each of these activities use resources of various types, for example the working hours of the supervisors or engineers. The activities performed by these resources are measured by cost drivers (Peter B.B. 1997).

The costs that can be associated directly to the product, as per traditional systems of cost accounting, are labor and direct materials. As per activity based accounting system, there are two types of activities – a. value added activities and b. non- value added activities and generally non- value added activities are reduced for improving the performance. ABC is quite useful in calculating costs accurately but it involves extra effort and expenditure for collecting the information required for cost analysis. These difficulties which come across in designing a cost model can be reduced by using a tool properly designed (Peter B.B. 1997).

Cost allocation and ABC approaches in for-profit firms (corporations)

Cost allocation and cost accounting systems are very crucial for any organization and in case of for- profit firms it become vital for the financial managers to be very careful about all the financial consequences within the organization or outside the organization. No any organization can make profit if their managers don’t consider the cost allocation factor seriously. The objective of cost allocation is to;

  1. compute valuations of assets and income and
  2. justify costs and attain reimbursement

For computing valuations of assets and income, cost allocation is done to projects and products for measuring costs of goods sold and inventory. The purpose of these allocations is to provide frequent service to financial accounting. Managers often use the resulting costs for performance appraisal, motivating employees and other managers and planning.

Most of the time prices depend on costs and an accepted bid is to be justified subsequently. This could be understood by citing the example of Boreal which is the largest company of Canada supplying scientific equipments and apparatuses to schools. It has a diverse line of products, hence the process of costing product is comparatively complex. Recently, a combination of several costing techniques for determining the cost of inventory and making allocations was used. The company has many departments for production and for each commodity the activities of production vary from each other. Three guidelines were kept in mind for making allocations:

  1. Fair allocation
  2. Verifiable and rational allocation
  3. Its impact must be known on people using or working with it

.The current input costs and changes in operating costs were reflected by the revised Inventory Costing System. These information were used for making cost allocations(Akyol , and Bayhan, 2005).

ABC approach proved to be beneficial for the company for following reasons:

  • Recalculating selling price
  • Calculating selling prices of different offers including mixture of products or quantity of products
  • Deciding about whether to produce a product in- house or to purchase from market
  • Calculating taxes
  • Calculating profits

The importance of allocations is quite visible in the above example and furthermore it has many intended uses (Peter B.B. 1997).

Different ways of implementing Cost allocation and ABC approaches in real-world business enterprises

In real world business enterprise the ways of implementing cost allocation and ABC approaches are different and they depend on the need and requirement of the enterprise. There is no any defined way of implementing cost allocation and ABC approaches in the real world business enterprise which can be implemented universally. The following example of a transmission company (PJM) illustrates the understanding of the ways of cost allocation. It classifies various methods of transmission cost allocation used in the United States and the world. The following five categories don’t stand alone but give a general idea about cost allocation (Cooper and Kaplan, 1988).

The costs of transmission can be allocated:

  • Between generation and load
  • Amount of usage
  • Generation or peak consumption
  • Basis of flow
  • Basis of monetary impact

These allocations can be implemented by following methods:

Direct Method – As per the name suggests, by direct method, any other service departments are ignored when the cost is being allocated for the department directly to the operating (revenue – producing) department. It can be explained as, the services provided by facilities management to personnel may be ignored as it is a kind of support provided to personnel by facilities management. The cost allocated for facilities management depend on the square meters area used by the production department only. Similarly, the costs of personnel department are allocated to the production department only depending on the number of workers working with it (Akyol , and Bayhan, 2005).

Step- Down Method – It is recognized in the step – down method that the activities of different services are supported by activities of other service departments including production department also. In this method, the allocations are made in a sequence. It starts with the service department providing the greatest service in terms of costs to the largest number of other service departments. It ends with the service department providing the least service in terms of costs to the least number of other service departments. For example, in this method, the cost would be allocated to facilities management before it is allocated to personnel department because facilities management provides more support to the personnel as compared to the support provided by personnel to the facilities management. Once the costs are allocated to facilities management, no costs are allocated back to personnel even if some services are provided to the facilities management by the personnel. The costs of personnel allocated to the production department include the costs allocated by facilities management for personnel (Peter B.B. 1997).

Reciprocal Allocation Method – In the reciprocal allocation method the cost is allocated after recognizing that the services are provided to each other by different service department including production department. This method is considered as the most ideal and correct method due to its ability to cost the relationship between different departments completely for the cost allocation to the service departments.

For example, as shown in the above methods, in this method the costs of the facilities management are allocated to the personnel department and the costs of the personnel department are allocated to the facilities management department before they are allocated to the department of production. The costs of the services are allocated first which are provided between two service departments (Cooper and Kaplan, 1988).

It can be noted that the costs can be affected greatly by the method of allocation selected. For example, using a direct method of allocation can make an operation more expensive in comparison to other methods like step- down method or reciprocal allocation method. Similarly, finishing can be an expensive operation if non- direct method of cost allocation is used.

Analysis of ABC’s potential strengths and weaknesses within a company

A number of indirect overhead manufacturing costs can be turned into direct costs by using activity based costing systems.  Direct costs mean the costs recognized specially with selected cost objectives. ABC enables managers to select appropriate cost drivers and activities to recognize numerous overhead manufacturing costs and cost objectives as simply as traditional accounting systems enable them to recognize direct material costs and direct labor costs.

ABC based systems classify most of the costs as direct cost which is not the case in traditional accounting systems. ABC system gives great confidence to managers as far as costs of services and products are concerned because they have more information (Özbayrak, Akgün and Türker, 2004).

On the other hand ABC systems are comparatively complex and expensive to traditional systems and it is not affordable by all companies. ABC systems are used by both manufacturing and service industries because of the following reasons:

  • Margins are shrinking due to increasing competition and companies ought to know their accurate margins for their services or products
  • Increasing complexity in the businesses has diversified products, services and even customers. The consumption of resources of the company also varies across customers and products
  • Introduction of new technologies are increasing the share of indirect costs and presently in manufacturing world indirect costs are more important. Automated machines are replacing direct labors.
  • Life cycles of products are shortened by changing technology and it has become difficult for companies to spare time for making price or cost adjustments once error are found

The costs of developing and operating systems are reduced substantially by the use of computers (Cooper and Kaplan, 1988).

Steps needed to ensure a successful implementation of ABC

An Activity based costing system requires four steps for its designing and successful implementation:

  • Determination of key activities, cost objectives and resources to be used is to be known and analyzed by the managers. They also need to identify the output measures (cost drivers) for each activity and resource.
  • A map is needed to be drawn by managers which should be based on process and be able to represent the activity – flow and resources supporting cost objects
  • The third step requires collection of operating data and cost

The last and final step requires calculation and interpretation of the new information based on ABC. A computer is required for the last step because of the complexity involved in activity based costing systems. The process of using ABC information for improvement of operations is known as Activity Based Management (Cooper and Kaplan, 1988).

The associated costs & benefits

The three main purposes of cost allocation are:

  • Motivation
  • Measurement of asset and income
  • Justification of cost or cost- plus contracts

By considering the above mentioned benefits of ABC system the cost involved in its implementation becomes regardless as the system enables to make calculations accurately which is very important for determining the profits. The cost involved in the implementation of ABC system is so high that it is beyond the reach of small enterprise but the benefits are so important that big enterprise cannot manage without it (Özbayrak, Akgün and Türker, 2004).

Efficiency gains

Activity concepts are utilized by Activity Based Costing systems which enables it to link successfully the costs of product to the knowledge of production. For example, what is the process of producing a product or service, what is the time required for the performance of an activity, and finally what is the amount of money required for performing the activity? These all questions are answered efficiently by ABC system of accounting (Cooper and Kaplan, 1988).

Profitability implications

ABC systems are used for inventory of products and determination of income. This is done by using the physical units or method of relative-sale-value. It is becoming popular gradually due to its ability of assigning costs to various activities within an organization, tracing costs to products or services depending on cost drivers measuring the reasons for the costs of the activity. It helps in improving profitability of the organization by quality improvement and waste elimination.

It also increases profitability by focusing on quality, reducing inventory, making production cycle short and by flexibly using human resources and operating assets. As these factors are non- value added activities and it results in reducing operating costs and increasing profitability (Özbayrak, Akgün and Türker, 2004).

Conclusion and recommendations

The traditional systems of accounting are gradually becoming irrelevant in the present competitive business world when things are changing very fast. Traditional costing system under costs the product because they are not able to consider the hidden costs involved in production. ABC systems enable to cost accurately and hence to calculate profitability accurately. Sometimes traditional methods over cost the product due to their incapability of calculating costs accurately and the price of the product become incompatible in the competitive market.

In nut shell it can be said that businesses have to adopt the Cost Allocation and ABC systems to sustain in the competitive business world. It is an expensive practice but keeping its utilities in mind the cost becomes negligible because it enables businesses to calculate profitability accurately without which business has no meaning.

References

Akyol D.E., Tuncel G. and Bayhan M. 2005. “World Academy of Science, Engineering and Technology”, Vol 3

Peter B.B. 1997. “Activity-Based Costing An Emerging Foundation for Performance Management”

Özbayrak M., Akgün M. and Türker A.K., 2004. “Activity-based cost estimation in a push/pull advanced manufacturing system,” International Journal of Production Economics, vol. 87, pp; 49–65

Cooper R., and Kaplan R.S. 1988. “How cost accounting distorts product costs,” Management Accounting, vol. 69,  pp; 20–27

Kim G., Park C.S. and Kaiser M.J. 1997. “Pricing investment and production activities for an advanced manufacturing system,” Engineering Economist, vol. 42, no. 4, pp; 303-324

Gunasekaran A. and Sarhadi M. 1998. “Implementation of activity-based costing in manufacturing,” International Journal of Production Economics, vol.56-57, pp; 231-242

Ben-Arieh D. and Qian L.2003. “Activity-based cost management for design and development stage,” International Journal of Production Economics, vol.83, pp; 169-183

Lewis R.J. 1995. “Activity-based models for cost management systems,” Quorum Books, Westport, CT

Köker U. 2003. “Activity-based costing: Implementation in a sanitaryware company,” M.Sc. Thesis, Department of Industrial Engineering, University of Dokuz Eylül

Cokins G. 1997. “Activity-based cost management making it works,” McGraw-Hill. Inc.

Elliot, B. & Jamie E. 2004. “Financial accounting and reporting”, Prentice Hall, London, p. 3,

Goodyear and Earnest L.1993. “Principles of Accountancy”, Goodyear-Marshall Publishing Co.,  p.7

Singh W. and Ramnik. AICPA committee on Terminology. Accounting Terminology Bulletin No. 1 Review and Résumé.

Friedlob, Thomas G. & Plewa, Franklin J.1996. “Understanding balance sheets,” pp; 1

Carruthers, Bruce G., & Espeland, W. N.1991. “Accounting for Rationality: Double-Entry Bookkeeping and the Rhetoric of Economic Rationality”, American Journal of Sociology, Vol. 97, No. 1, pp: 40-41,44 46,

View Finance Dissertations Here